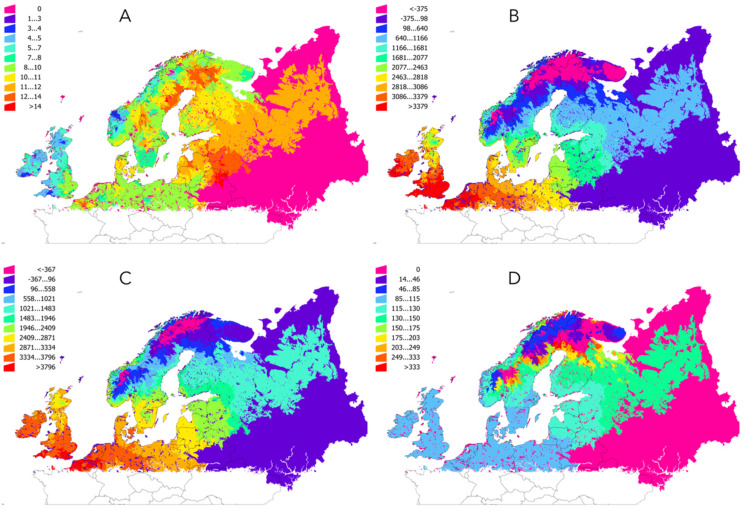
Figure 2.
Changes in temperature in the period 1950-2018. (A) The slope of the changes of temperature of the complete period. The large territory in Russia with a homogeneous value of “0” are areas where no temperature data are available. Minute areas of the territory across Europe with a value of “0” are polygons smaller than the resolution of the layers of temperature (no data). (B) The average annual accumulated °C in the period 1950–1989. (C) The average annual accumulated °C in the period 1990–2018. (D) The ratio of change in temperature between the period 1950–1989 and 1990–2018 (a change of 100% means for twice the temperature between 1950–1989 and 1990–2018).

