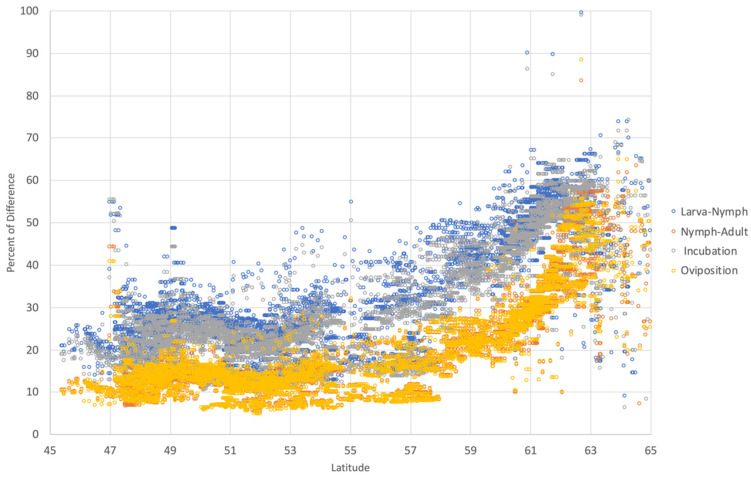
Figure 4.
The percent of change of development stages of I. ricinus in the period 1950–2018 according to the latitude of the target region. Each dot corresponds to the value of each single cell of 0.25° of resolution over the complete target territory in Europe. All the rates of development are higher at northern latitudes (above approximately 58°N).

