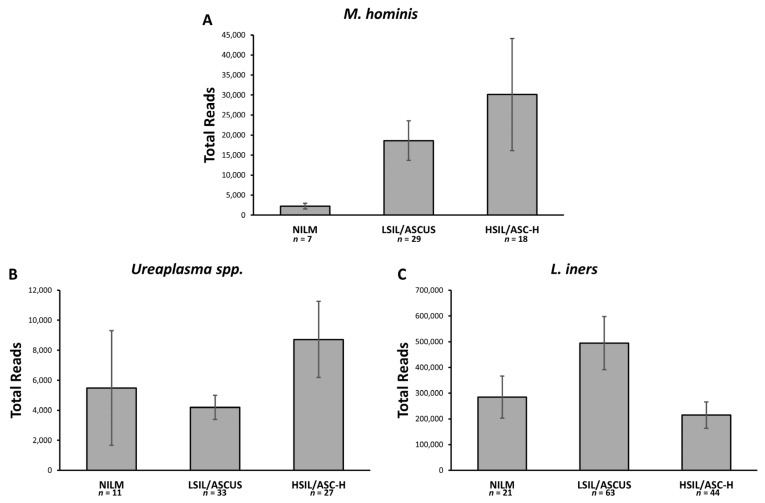
Figure 2.
Relative abundance of Mycoplasma based on cervical cytology. Abundance among infected is the mean of positive 16s samples (n) adjusted by prevalence determined by PCR screen. Error bars represent standard error of the mean. (A) Expected number of M. hominis 16s DNA reads for 100 Tanzanian women of varying cervical cytology; (B) Expected number of Ureaplasma spp. 16s DNA reads for 100 Tanzanian women of varying cervical cytology; (C) Expected number of L. iners 16s DNA reads for 100 Tanzanian women of varying cervical cytology.

