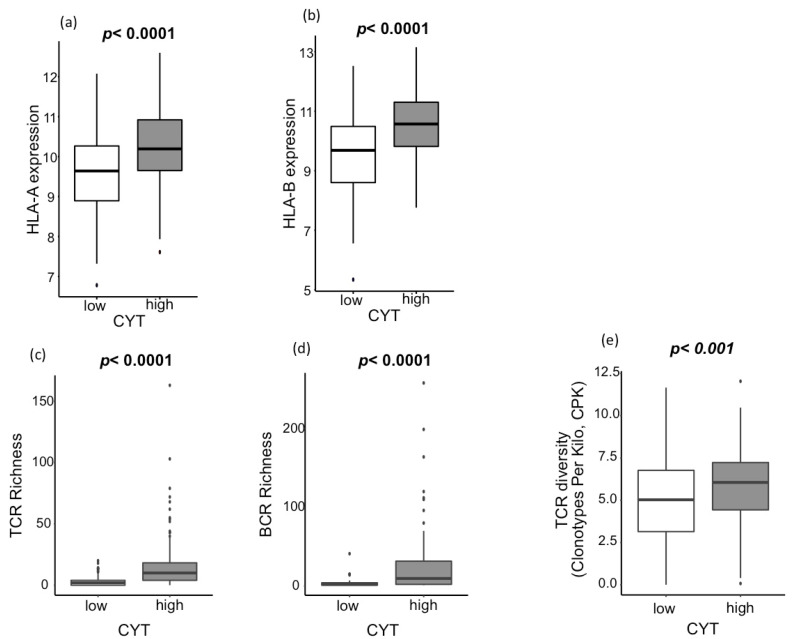
Figure 3.
Association between the CYT and tumor-infiltrating lymphocyte receptor genetic diversity (a,b) Association between the CYT and human leucocyte antigen (HLA) expression. (a) Association between the CYT and HLA-A expression (p < 0.0001), and (b) association between the CYT and HLA-B expression (p < 0.0001). (c–e) Association between the CYT and lymphocyte receptor genetic diversity. (c) Association between the CYT and TCR richness (p < 0.0001), (d) association between the CYT and BCR richness (p < 0.0001), and (e) association between the CYT and TCR diversity (p < 0.001). CYT-high patients were 185 patients, and CYT-low were 186 patients. All comparisons were performed using the Mann-Whitney test. CYT, cytolytic activity score; TCR, T-cell receptor; BCR, B-cell receptor; and CPK, clonotypes per kilo.

