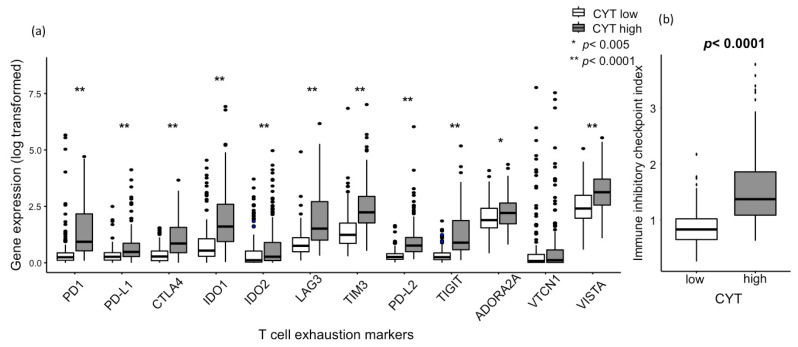
Figure 4.
Association between the CYT and gene expression of regulatory T-cell markers. (a) Association between the CYT and major T cell exhaustion marker gene expressions, including PD-1 (p < 0.0001), PD-L1 (p < 0.0001), CTLA4 (p < 0.0001), IDO1 (p < 0.0001), IDO2 (p < 0.0001), LAG3 (p < 0.0001), TIM3 (p < 0.0001), PD-L2 (p < 0.0001), TIGIT (p < 0.0001), ADORA2A (p < 0.005), and VISTA (p < 0.0001). (b) Association between the CYT and immune inhibitory checkpoint index, generated from the key T cell exhaustion marker expression (p < 0.0001). CYT-high patients were 185 patients, and CYT-low were 186 patients. All comparisons were performed using the Mann-Whitney test. CYT, cytolytic activity score; PD-1, programmed death protein-1; PD-L1, programmed death-ligand 1; CTLA4, cytotoxic T-lymphocyte-associated protein 4; IDO1, indoleamine 2,3-dioxygenase 1; IDO2, indoleamine 2,3-dioxygenase2; LAG3, lymphocyte-activation gene3; TIM3, T cell immunoglobulin and mucin domain 3; PD-L2, programmed death-ligand 2; TIGIT, T cell immunoreceptor with Ig and ITIM domains; ADORA2A, adenosine A2a receptor; and VISTA, V-domain Ig suppressor of T cell activation.

