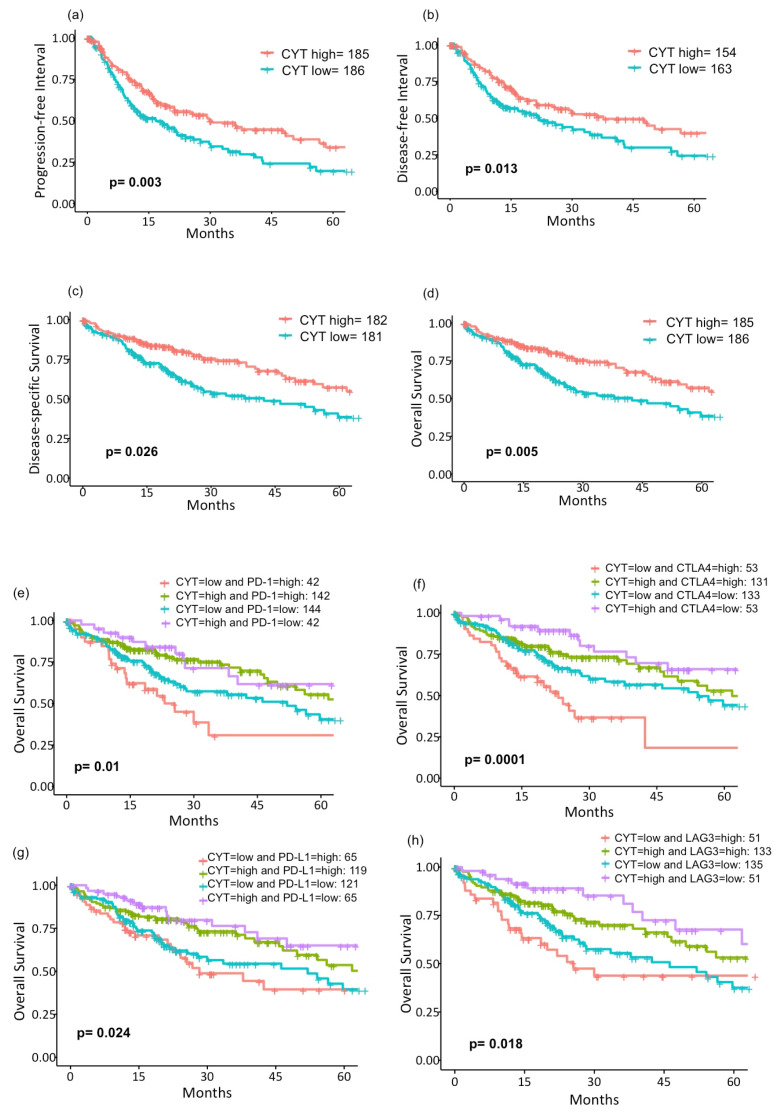
Figure 5.
Survival analysis of the cancer genome atlas (TCGA) liver hepatocellular carcinoma (LIHC) patients. Kaplan-Meier curves of (a) PFI (p = 0.003), (b) DFI (p = 0.013), (c) DSS (p = 0.026), and (d) OS (p = 0.005) in CYT-high vs. -low patients. Survival curves of OS were further stratified by four major T cell exhaustion markers using the median value of each expression. (e) PD-1 (p = 0.01), (f) CTLA4 (p = 0.0001), (g) PD-L1 (p = 0.024), and (h) LAG3 (p = 0.018). Log-rank test was used to test group differences in survival analyses. CYT, cytolytic activity score; PFI, progression-free interval; DFI, disease-free interval; DSS, disease-specific survival; OS, overall survival; PD-1, program death-1; CTLA4, cytotoxic T-lymphocyte-associated protein 4; PD-L1, program death-ligand 1; and LAG3, lymphocyte-activation gene 3.

