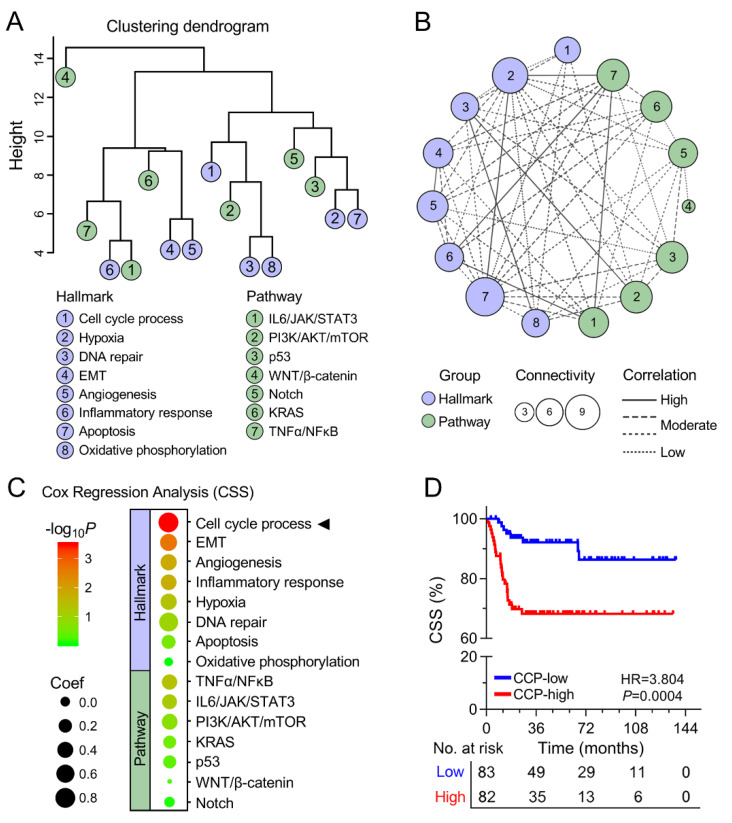
Figure 2.
CCP was identified as the primary risk factor for CSS. (A) Hierarchical clustering dendrogram was generated to show the distance between different hallmarks and pathways. (B) A network was constructed to depict relationships between different hallmarks and pathways. (C) Bubble heatmap of Cox results indicated that CCP serves as the most powerful risk factor for CSS. (D) Kaplan–Meier curve demonstrated that patients with higher CCP single-sample gene set enrichment analysis (ssGSEA) scores exhibited worse CSS compared to those with lower scores.

