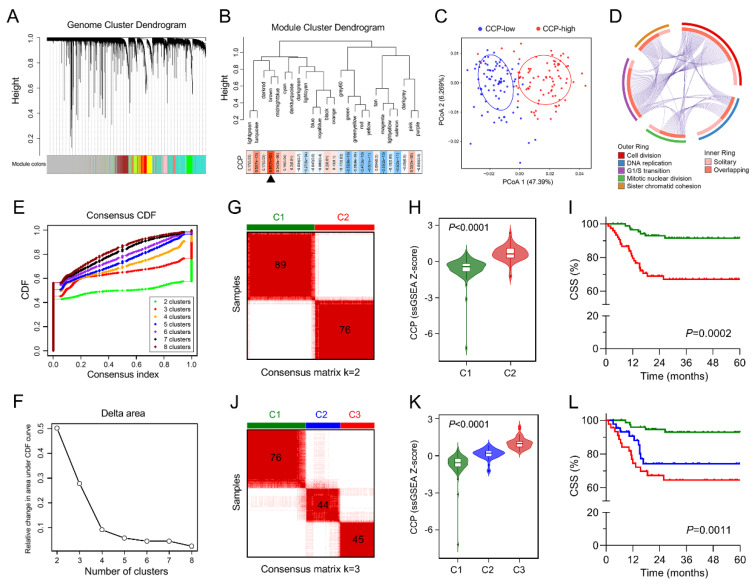
Figure 3.
Identification of a CCP-related gene module. (A) Weighted correlation network analysis (WGCNA) was performed with transcriptome profiling data and CCP ssGSEA Z-scores in the training set. (B) The brown module depicting the highest correlation (r = 0.87, p = 7e–52) with CCP ssGSEA scores was considered as “CCP module”. (C) Principal coordinates analysis (PCoA) was performed to visualize the dissimilarity of CCP-low and CCP-high samples based on the Bray–Curtis distance matrix. (D) Circos plot demonstrated that all of five most significant processes were labelled with cell cycle-related features. (E) Based on expression pattern of genes involved in the brown module, K-means-based consensus clustering was performed to classify the training group into different subgroups. Cumulative distribution function (CDF) plot showed the cumulative distribution functions of the consensus matrix for each k (from 2 to 8, indicated by colors). (F) The difference between two CDF curves (k and k-1) is illustrated by measuring the area under the CDF curves from k = 2 to 8 in the delta area plot. (G,J) k = 2 and 3 were chosen as optimal parameters to divide the training cohort into different subgroups. (H,K) Violin plots showed that CCP ssGSEA scores were differentially distributed in identified subgroups. (I,L) Patients exhibited different CSS in identified subgroups.

