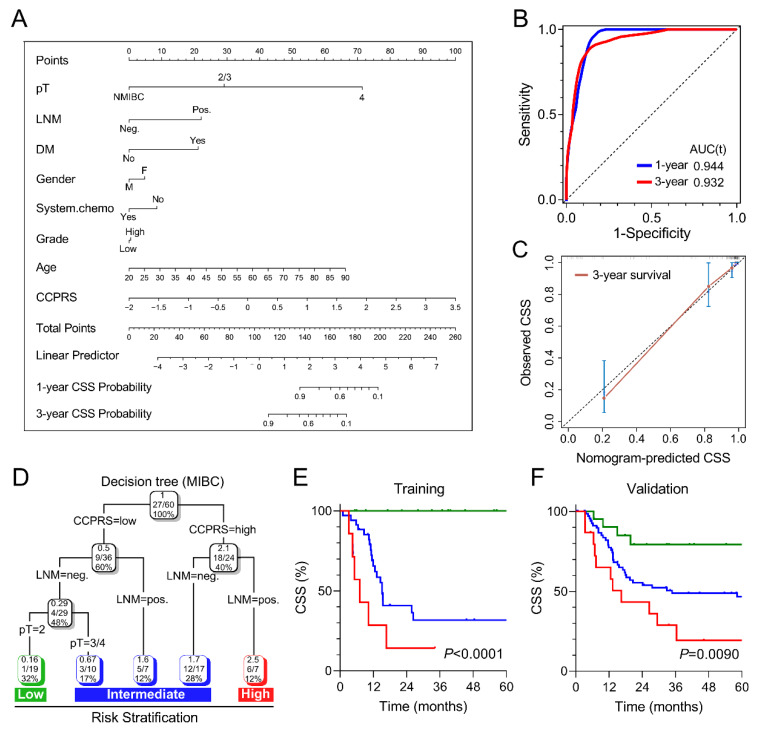
Figure 8.
Combination of CCPRS and clinical variables to improve risk assessment and stratification. (A) A nomogram was constructed to quantify risk assessment and predict CSS probability for individual patients. (B) Time-dependent ROC analysis was performed to evaluate the predictive power of the nomogram for 1-year and 3-year CSS. (C) Calibration analysis indicated the nomogram has a high accuracy of CSS prediction. (D) An integrated decision tree was generated to optimize the risk stratification for MIBC patients. (E) In the training cohort, MIBC patients in the high-risk group exhibited worst CSS compared to other groups (p < 0.0001). (F) Significant difference of CSS was observed among different risk subgroups in the validation cohort.

