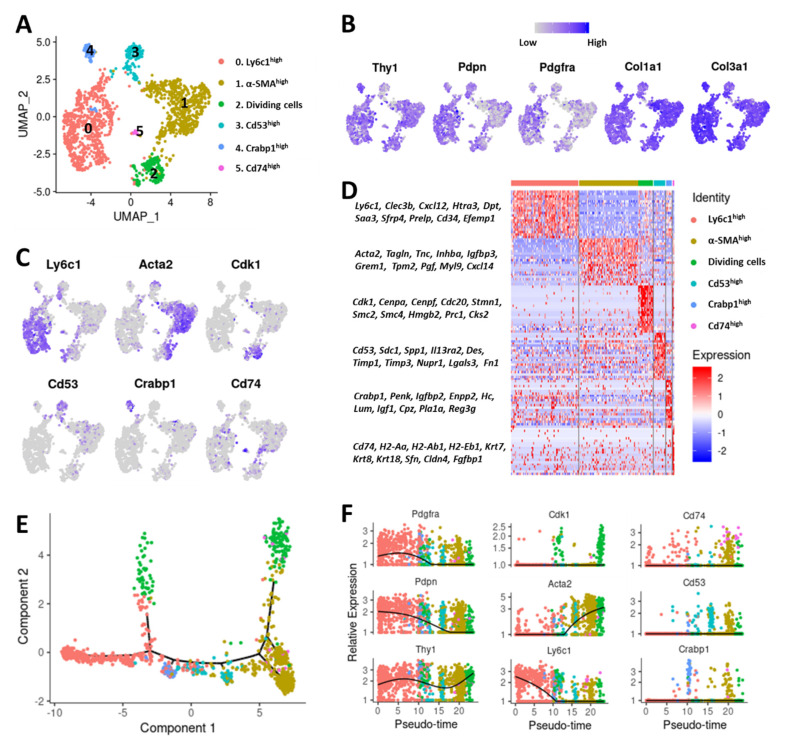
Figure 2.
Characterization of CAF subtypes in 4T1 breast cancer. (A) Cell clusters from 10x Genomics scRNA-seq analysis visualized by UMAP. Colors indicate various CAF subtypes. (B) Feature plots showing the expression of commonly used CAF markers in various CAF subtypes. Legend shows a color gradient of normalized expression. (C) Markers of various CAF subtypes that were used to denote each subtype. (D) Heatmap showing a subset of genes differentially expressed between the 6 CAF subtypes. (E) Monocle pseudospace trajectory colored based on CAF clusters in (A). (F) Expression of CAF markers on a pseudotime scale (colored based on CAF clusters in (A)).

