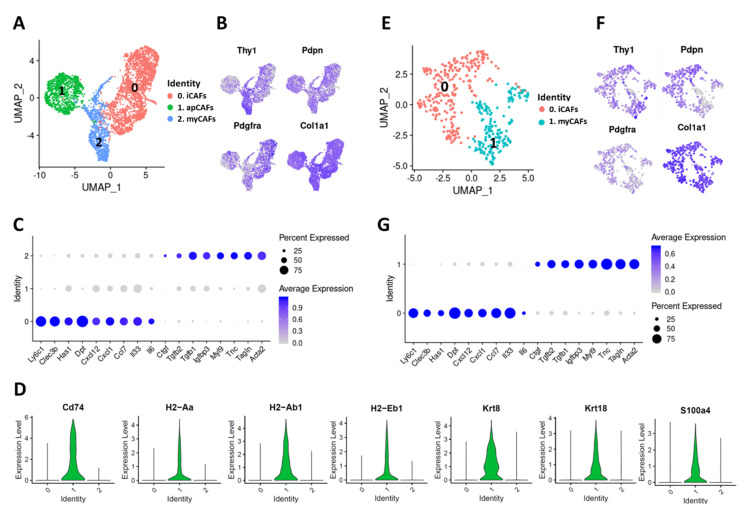
Figure 4.
Characterization of CAF subtypes in murine PDAC. (A) UMAP plot showing various CAF subtypes identified in PDAC tumors from KPC mice. (B) Expression of commonly used CAF markers in KPC-derived PDAC CAFs. (C) Dot plot showing the expression of selected markers of Ly6c1high CAFs (iCAFs) and α-SMAhigh CAFs (myCAFs) in KPC-derived PDAC CAFs. Dot size represents the fraction of cells expressing a specific marker in a particular cluster and intensity of color indicates the average expression in that cluster. (D) Violin plots showing the expression of Cd74high CAF (apCAFs) markers in KPC-derived CAFs (cluster identities on X-axis). (E) CAF subtypes identified in subcutaneous mT3 tumors. (F) Expression of commonly used CAF markers in mT3 tumor-derived CAFs. (G) Dot plot showing the expression of selected iCAF and myCAF markers in mT3-derived CAFs.

