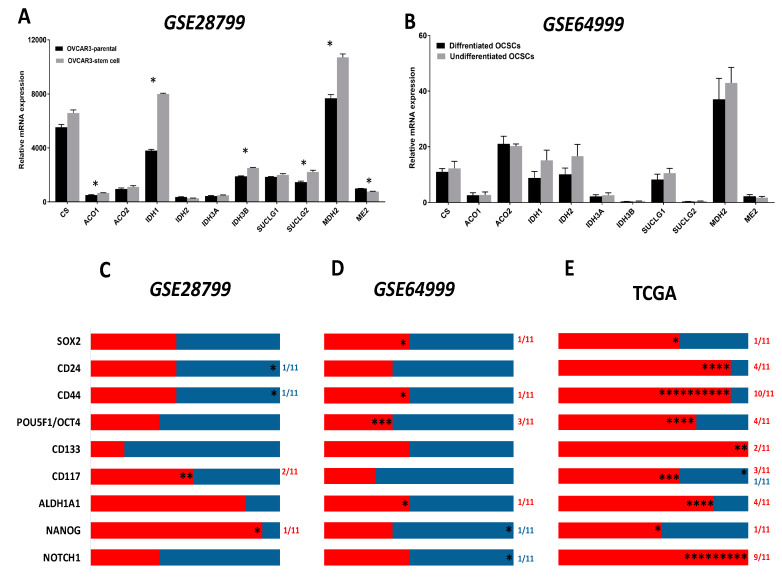
Figure 4.
Expression of TCA markers in OCSC models. (A,B) Bars represent mean ± SEM of the relative mRNA expression of the indicated TCA enzymes in OVCAR3 stem-cells vs. their parental cells in GSE28799 and undifferentiated vs. differentiated OCSCs in GSE64999. Significance was determined using the multiple t-test and Holm–Sidak method with each row analyzed individually with p < 0.05, without assuming a consistent SD. (C–E) Bar graphs represent the prevalence of positive (red) and negative (blue) correlations of the indicated OCSC markers and TCA enzymes in Supplement Tables S3–S4 and Table 2. * indicate the number of significant correlations either positive or negative.

