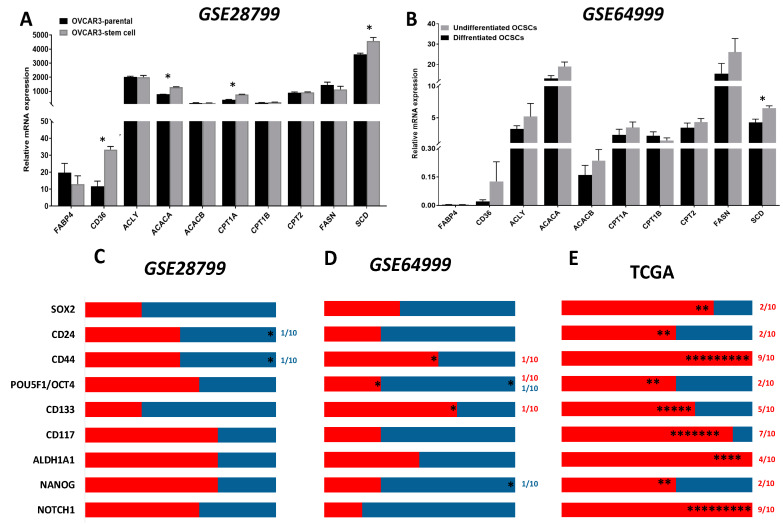
Figure 7.
Expression of transporters and enzymes of lipid metabolism in OCSC models. (A,B) Bars represent mean ± SEM of the relative mRNA expression of the indicated transporters and lipid metabolism enzymes in OVCAR3 stem-cells vs. their parental cells in GSE28799 and undifferentiated vs. differentiated OCSCs in GSE64999. Significance was determined using the multiple t-test and Holm–Sidak method with each row analyzed individually with p < 0.05, without assuming a consistent SD. (C–E) Bar graphs represent the prevalence of positive (red) and negative (blue) correlations of the indicated OCSC markers and lipid metabolism enzymes in Supplement Tables S7–S8 and Table 4. * indicate the number of significant correlations either positive or negative.

