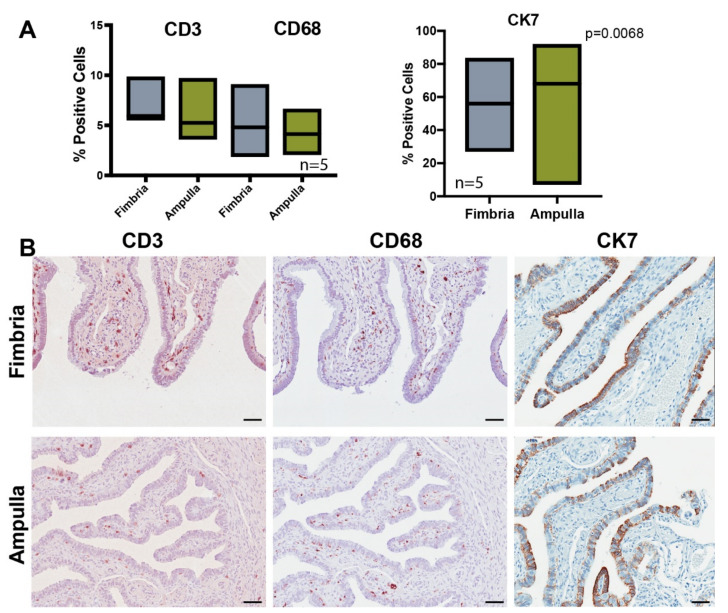
Figure 5.
Immune cell profiling of the fimbria and ampulla show differences in immune cells between fimbria and ampulla. (A) Immunohistochemistry of CD3, CD68 and CK7 markers was performed on five cases to show the percentage of cells positive for each marker across fimbria and ampulla. Only CK7 showed significant differences in expression between the fimbria and ampulla. Statistical tests using an unpaired t-test were used in all comparisons (p < 0.05). (B) Bright field microscopic images of fimbria and ampulla tissue sections show differences in protein expression of CD3, CD68 and CK7 between the two tissues. Scale bar: 200 µm.

