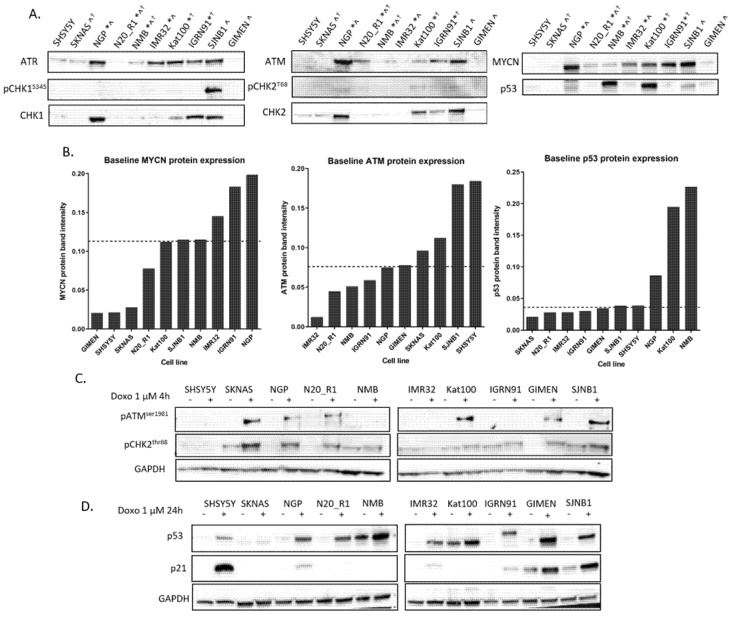
Figure 1.
Expression and function of key DNA damage response (DDR) proteins in a panel of neuroblastoma (NB) cell lines. (A) Baseline protein expression of Rad3 related (ATR), ataxia telangiectasia mutated (ATM), CHK1, CHK2, phospho-CHK1S345, phospho-CHK2T68 MYCN and p53 in NB cell lines used in this study. Ponceau S stain was used as a loading control (Figure S1). *MYCN amplified, ^11q deleted, ✝TP53 mutant. (B) MYCN, ATM and p53 mean protein band intensity measured by densitometry (ImageJ) and normalised to total protein (Ponceau S) from 2 replicates. Cell lines are ordered by protein expression from low to high. The dashed line indicates median expression of each protein. (C) ATM function was determined by phospho-ATMS1981 and phospho-CHK2T68 expression after treatment with 1 μM doxorubicin (doxo) for 4 h. (D) p53 function was determined by p53 and p21 expression after treatment with doxo for 24 h. Images of the uncropped Western blots for A and C, D can be found in Figures S1 and S2.

