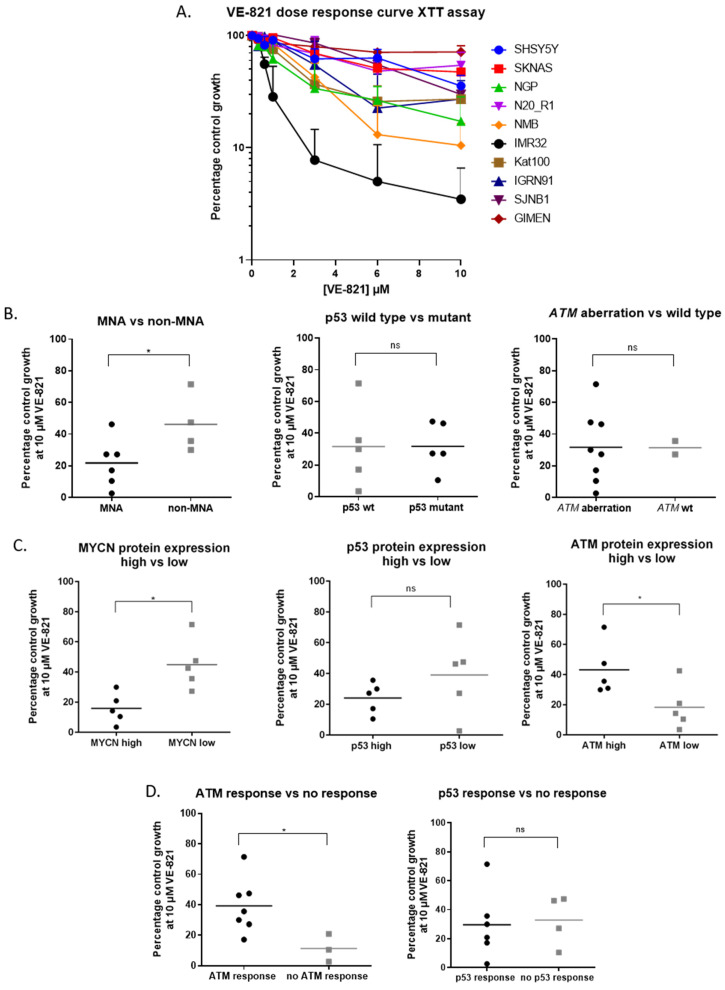
Figure 2.
Determinants of ATR inhibitor sensitivity. (A) VE-821 (ATR inhibitor) dose response curves for NB cell lines, data are mean + SEM from 3 independent experiments. Cell lines were split into 2 groups based on (B) molecular features: MYCN amplification (MNA), p53 mutation status and ATM aberration (11q deleted or ATM mutated), (C) protein expression above (high) or below (low) median expression (Figure 1B) and (D) ATM and p53 responses after treatment with doxorubicin (1 µM). ATM and p53 response was determined by expression of pATMser1981 and p21, respectively (Figure 1C,D). Average percentage control growth at 10 µM VE-821 was plotted for cell lines belonging to each group (n = 3). * p < 0.05 Mann Whitney U test, ns: not significant, wt: wildtype).

