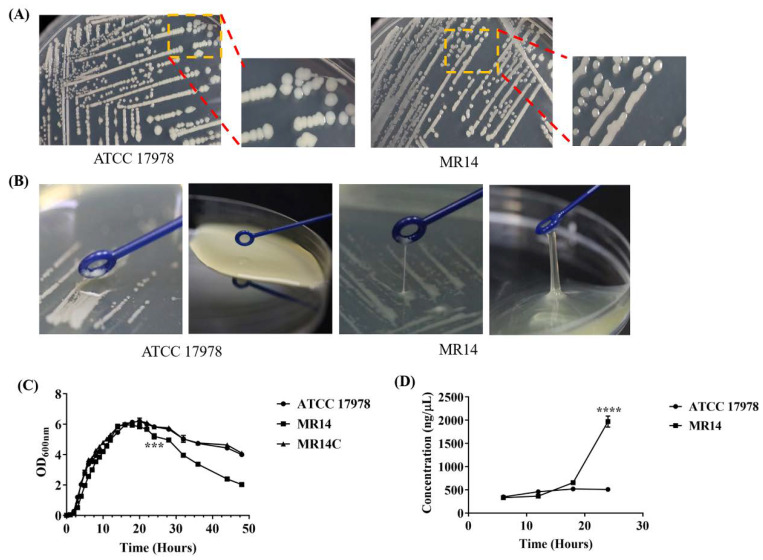
Figure 4.
Colony appearance and growth curve of culture ATCC 17978 and Ctp mutant MR14. (A) The wild-type ATCC 17978 formed non-mucoid colonies on LB agar (left), and the Ctp mutant MR14 formed mucoid, shiny colonies (right). (B) When touched with an inoculation loop, the MR14 strain formed mucoidy, sticky strands on the LB plate after five days of incubation at 4 ℃, and on LB media after incubation for 18 h (right) in contrast to ATCC 17978 (left). (C) Growth curve analysis shows a reduced OD600 value of MR14 after 18 h of culture compared to ATCC 17978. (D) Extracellular DNA (eDNA) quantification over the temporal scale of growth. The error bars represent standard error of the mean obtained from three independent experiments. *** p < 0.001, **** p < 0.0001.

