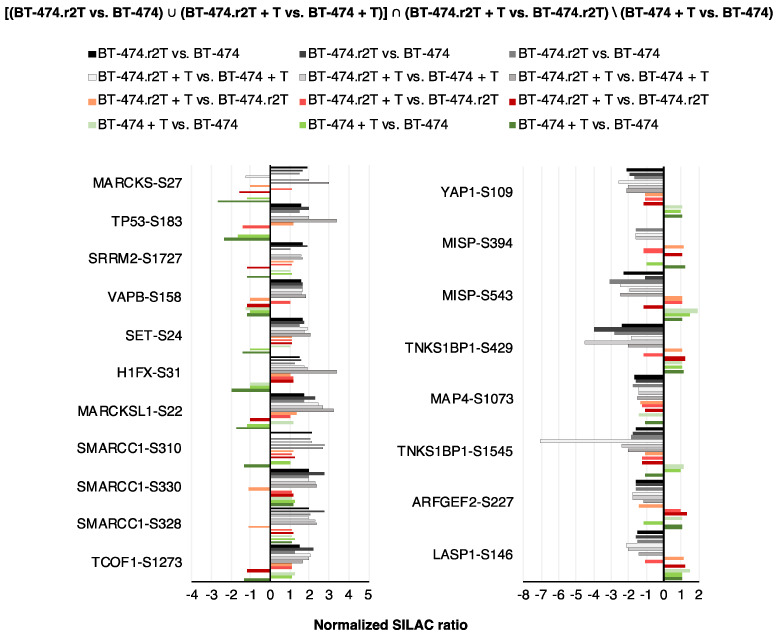
Figure 2.
Phosphoproteomics analysis identified up- and downregulated candidates in acquired trastuzumab-resistant BT-474.r2T cells compared to parental sensitive BT-474 cells. Proteins selected in the phosphoproteomic SILAC assay according to their significantly downregulated or overexpressed phosphosites in BT-474.r2T vs. BT-474 cells (overlapping of the three datasets). Bar graphs represent FC of Class-1 phosphosites identified in different temporary conditions, with annotation of the modified residue.

