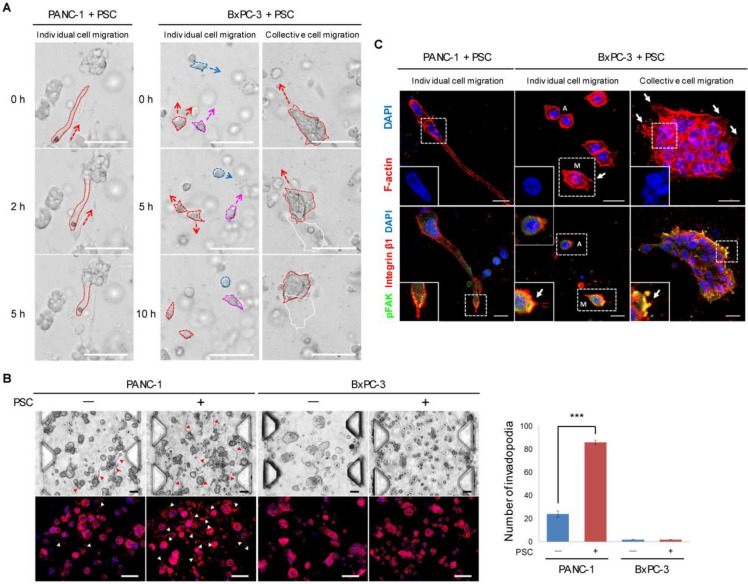
Figure 3.
Difference in migration mode and FAK activation between PANC-1 and BxPC-3 cells in a collagen matrix. (A) Time-lapse images of cell migration under PSC co-culture conditions, showing differential migration modes. Direction of cell migration is indicated by arrows. Scale bar: 100 µm. (B) Increased number of invadopodia (arrowhead) in PANC-1 TSs under PSC co-culture conditions. Scale bar: 100 µm. (C) Comparison of podium morphology and expression of pFAK at the leading edge of the protrusion between PANC-1 and BxPC-3 cells under co-culture conditions. A: amoeboid mode. M: mesenchymal mode. White arrow: spike-like filopodia. Scale bar: 20 µm. Three fields covering 80% of the effective area in each channel were imaged per experiment and subjected to analysis. Data were obtained from three separate independent experiments. *** p < 0.005.

