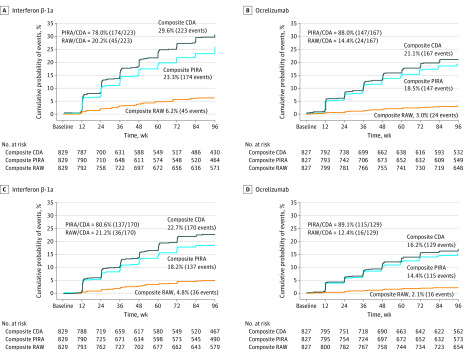
Figure 2. Relative Contributions of Composite Relapse-Associated Worsening (RAW) and Progression Independent of Relapse Activity (PIRA) vs Overall Composite Confirmed Disability Accumulation (CDA) in Treatment Groups.
The graphs compare the 12-week confirmed (A and B) and 24-week confirmed (C and D) overall composite CDA. All percentages indicate Kaplan-Meier proportions of patients with confirmed disability accumulation at week 96 in the pooled OPERA I and OPERA II intention-to-treat population.

