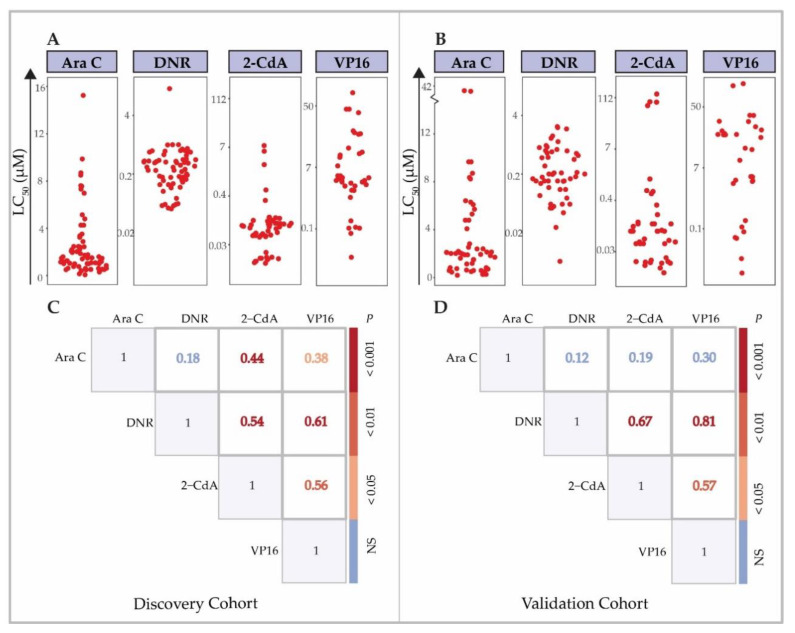
Figure 2.
Distribution of ex vivo drug response data (LC50) for chemotherapeutic drugs and cross-resistance. ex vivo drug response of primary AML cells to: Ara C, DNR, 2-CdA and VP16. Data are depicted as LC50 values, the drug concentration (µM) at which 50% of the cells in the assay die. Each dot represents the LC50 value of an individual sample. (A) Ex vivo drug response in discovery and (B) independent validation cohort. Cross-resistance between the tested drugs in (C) the discovery cohort and (D) validation cohort. Numbers represent the Spearman’s correlation coefficient of LC50 values between shown drugs. p-value is calculated likewise and depicted according to the indicated color scheme.

