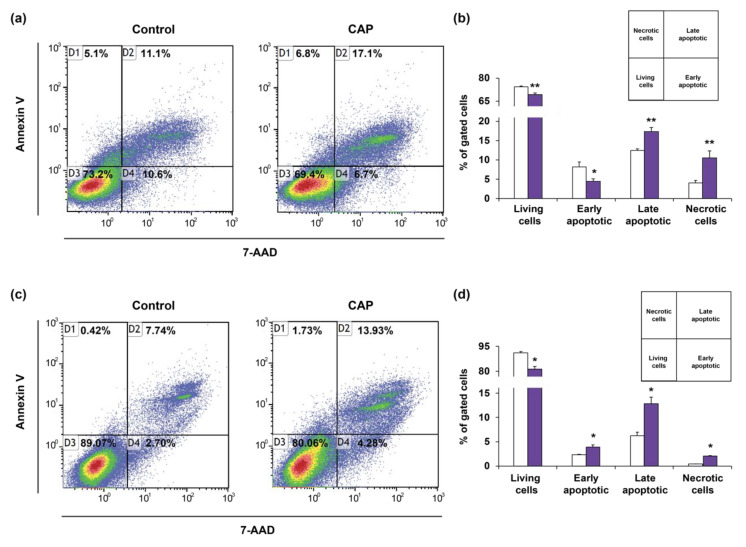
Figure 7.
(a–d) Representative images (a,c) and quantification (b,d) of apoptosis by flow cytometry analysis of Annexin V/7AAD in EGI-1 (a,b) and HuCCT1 (c,d) CCA cells after 48 h of exposure to PAM for 3 min. (9 kV, 30 kHz, 14%, gap of 7 mm). Values are expressed as means ± SEM from at least three independent cultures. *, p < 0.05; **, p < 0.01; compared with control condition.

