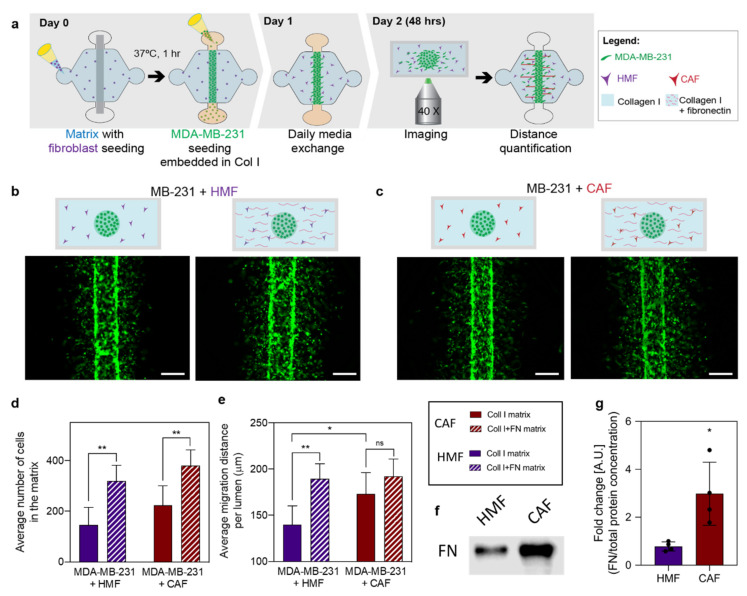
Figure 2.
Influence of extracellular matrix (ECM) protein and fibroblast composition in cancer cell migration. (a) Schematic of the experimental process consisting of cell seeding, media exchanges, and imaging after 48 h of culture to track cell migration. (b,c) Fluorescence images of green fluorescent protein (GFP) tagged MDA-MB-231s within different matrix compositions in co-culture with human mammary (HMFs) and cancer-associated fibroblasts (CAFs). (b) MDA-MB-231 co-cultures with HMFs in a collagen matrix (left) and a fibronectin-rich matrix (right). (c) MDA-MB-231 co-cultures with HMFs in a collagen matrix (left) and a fibronectin-rich matrix (right). Scale bar = 200 µm. (d) The average number of cells in the matrix. (e) Average migration distance measured from the edge of the lumen after 48 h of culture. (f) Representative western blot of fibronectin (g) Quantification of fibronectin protein normalized to total protein determined by SYPRO Ruby staining (whole lane fluorescence). Bars represent average ± SD, n = at least four individual devices. * p ≤ 0.05, ** p ≤ 0.01.

