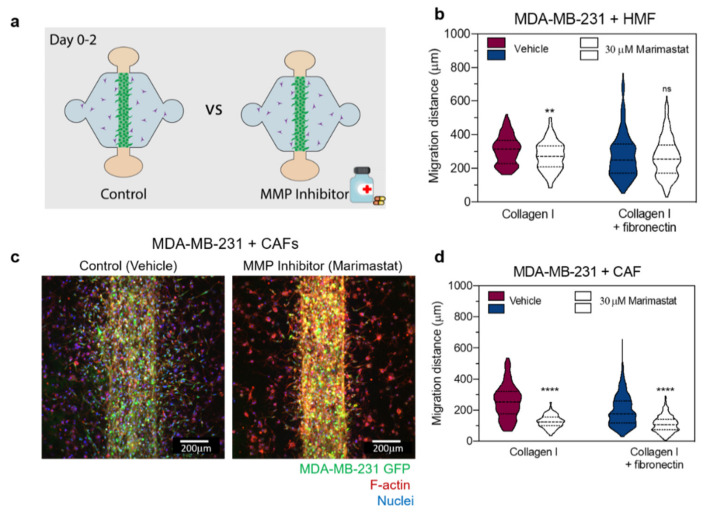
Figure 5.
Effect of MMP inhibition on cancer cell migration. (a) Schematics of the experimental conditions. Co-cultures within the different matrices were treated for 48 h with 30 µM marimastat (MMP inhibitor) and a Dimethyl sulfoxide (DMSO) vehicle (control). (b) Migration distance of MDA-MB-231 in co-cultures with HMFs in the collagen matrix (left) and the fibronectin-rich matrix (right) for the vehicle control and treatment. (c) Representative image of the co-culture with CAFs for the vehicle control (left image) and treatment with 30 µM marimastat (right image). (d) Migration distance of MDA-MB-231 in co-cultures with CAFs in the collagen matrix (left) and the fibronectin-rich matrix (right) for the vehicle control and treatment with 30 µM marimastat. The Violin plots represent the distribution of the data with the average and SD, n = 3 for at least four individual devices. ** p < 0.01 and **** p < 0.0001.

