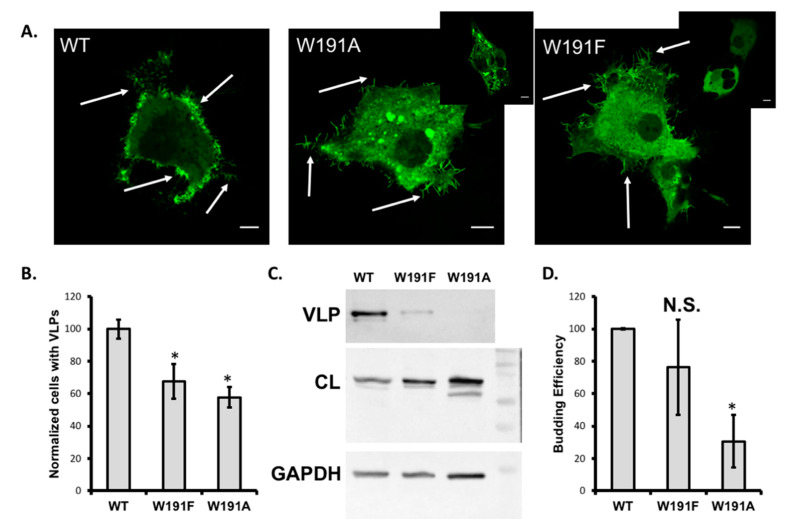
Figure 2.
Plasma membrane localization and virus-like particle (VLP) formation of wild-type (WT) and VP40 eTrp191 mutations. (A) COS-7 cells were used to express WT EGFP–VP40, EGFP–W191A, or EGFP–W191F and were imaged 12–14 h post-transfection. Each construct was imaged independently (3 times) and multiple cells were counted for each trial to determine the number of cells with pre-VLP structures emanating from the plasma membranes. White arrows indicate the presence of pre-VLPs in the respective images above. Insets are shown for both W191A and W191F to demonstrate differences observed in some cells for each mutant, where pre-VLPs were lacking. The W191A mutant also displayed perinuclear puncta in a large number of cells. Scale bars = 10 μm. (B) Quantification of cells imaged in (A) were plotted as normalized cells with VLPs (normalized to WT) from the three independent measurements. (C) VLP formation was assessed ~24 h post-transfection as previously described [16]. Precision Plus ProteinTM Kaleidoscope Pre-stained Protein Standards (BioRad, Hercules, CA, USA) were used and shown in the right most lane. The bands shown from top to bottom are 100 kDa, 75 kDa, 50 kDa, and 37 kDa. eVP40 was quantified by Western blot for eVP40 in purified VLPs or eVP40 in cell lysates (CL). GAPDH was used as a loading control. The 37 kDa band of the Precision Plus ProteinTM Kaleidoscope Pre-stained Protein Standards is shown in the right most lane. (D) Budding efficiency was normalized to WT and plotted for W191F and W191A. Statistical analysis was performed for panels (B) and (D) where a * indicates p < 0.05.

