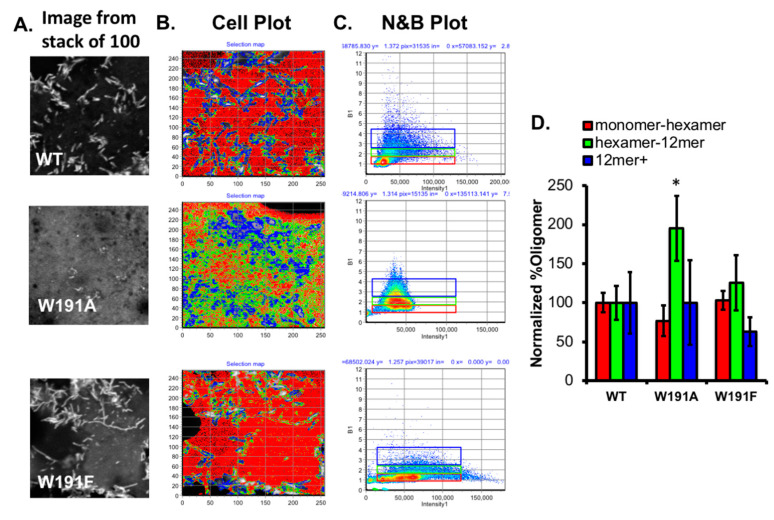
Figure 3.
Oligomerization of VP40 and Trp191 mutations in COS-7 cells. (A) Raster image correlation spectroscopy (RICS) was performed on COS-7 cells expressing WT EGFP–VP40, EGFP–W191A, or EGFP–W191F. One image from a stack of 100 is shown to reflect the localization of VP40 throughout the image. (B) SimFCS was used to analyze the RICS data and determine the apparent oligomerization state of VP40 per pixel in the image. Red pixels indicate monomer–hexamers, green pixels indicate hexamer–12mer populations, and blue pixels indicate 12mer and greater populations. The color and oligomer populations reflect that shown in panels (C) and (D). (C) Brightness (y-axis) versus intensity (x-axis) was plotted (corresponding to different colors in images (B) and (D)). The selected colored boxes reflect the region selected for monomer–hexamer (red), hexamer–12mer (green), and 12mer and greater (blue). (D) N&B analysis was used to determine the number of monomer–hexamer, hexamer–12mer, and 12mer and greater populations of EGFP–VP40 or mutations throughout the images. Each oligomer population was normalized to WT to assess the differences between mutant and WT populations. * p < 0.05.

