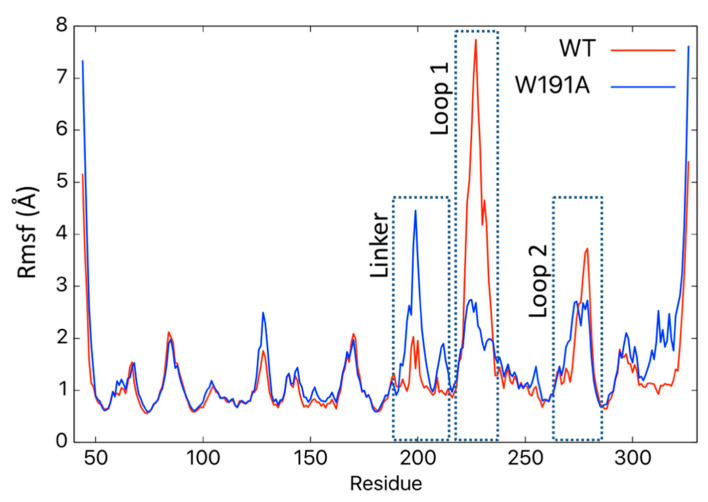
Figure 7.
The root-mean-squared fluctuations (Rmsf) of VP40 residues in WT and W191A VP40. MD simulations predicted changes in the Rmsf in Å for different residues in WT (red) and W191A (blue) VP40. The regions for the NTD–CTD linker, Loop 1 and Loop 2 display the most significant changes in fluctuations between WT and W191A.

