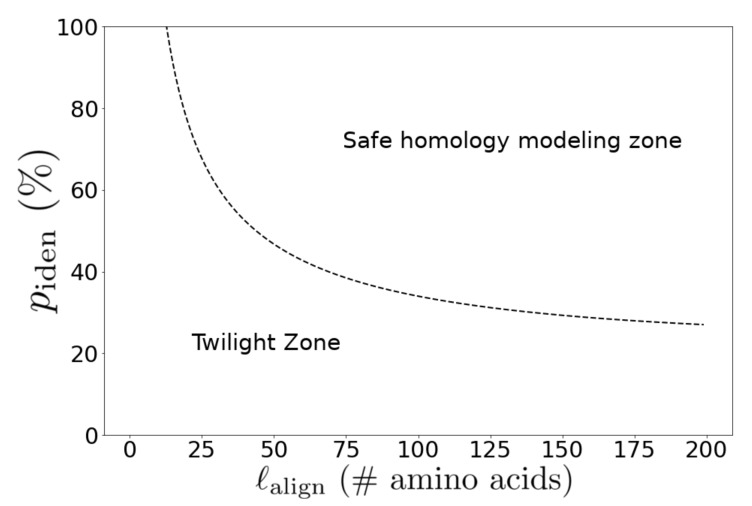
Figure A1.
Rost’s phenomenological curve (Equation (1)) of minimum percentage identity for homology modeling as a function of pairwise alignment length with padding as employed in this work. As the length of the alignment decreases, the minimum percent identity for homology modeling increases, and there is a particularly rapid increase below alignments of about 25 amino acids, where a fairly large proportion of toxins reside.

