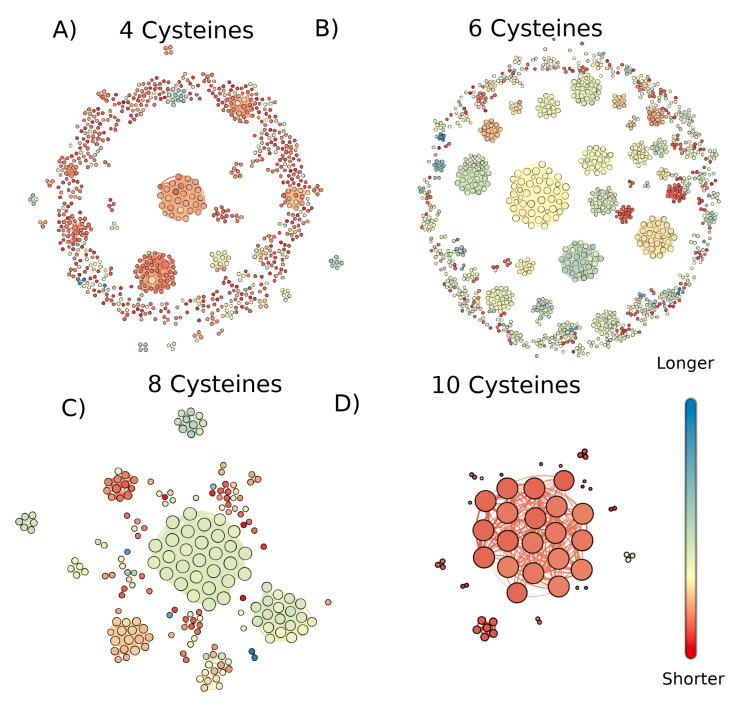
Figure A2.
Graph of conotoxins containing (A) four cysteines, (B) six cysteines, (C) eight cysteines, and (D) ten cysteines where nodes are sequences and edges exist between sequences with pairwise alignments that have a high enough length and percent identity to fall above the Rost curve with (Equation (1)). Colors show the relative sequence lengths of each node, but the color scale of each graph is independent of the others. The sizes of the nodes correspond to their degree; that is, the number of other sequences that they can be modeled based on or used to model. Node locations and edge lengths were chosen for ease of visualization of separate connected components. Visualization of the graphs was produced with Gephi 0.9.2 [39].

