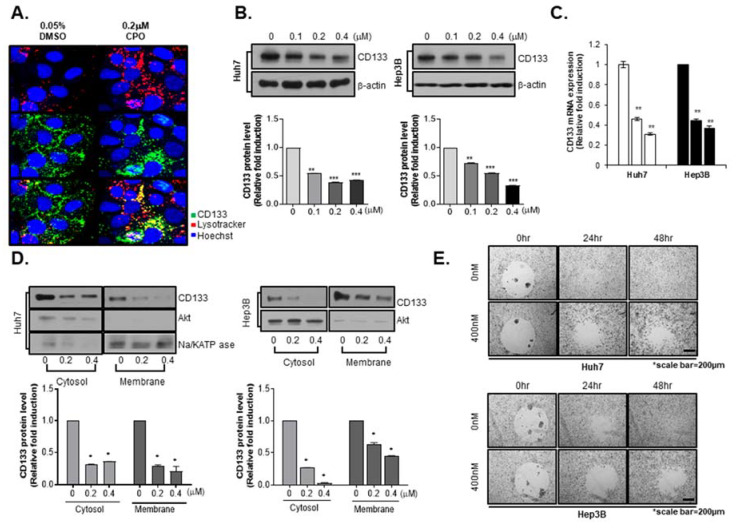
Figure 4.
Subcellular localization and degradation of CD133 induced by chromenopyrimidinone (CPO). (A) Immunocytochemistry images of CD133 (green), lysosomes (red), and the nucleus (blue) after treating Huh7 cells with or without 200 nM CPO for 48 h. Images were obtained using an HCS system with a 40× objective. (B) Expression level of CD133 after treating Huh7 (left panel) and Hep3B (right panel) cells with 100 nM, 200 nM, or 400 nM CPO for 48 h. Expression of proteins was quantified (lower panel). β-actin was used as the control (whole blot image, Figure S4). (C) Expression level of CD133 mRNA after treating Huh7 and Hep3B cells with 200 nM or 400 nM CPO for 48 h. β-actin was used as the control. (D) CD133 expression levels in the cytosol and membranes after treating Huh7 (left panel) and Hep3B (right panel) cells with or without 200 nM or 400 nM CPO for 48 h. Expression of CD133 protein was quantified (lower panel). NA+/K+-ATPase was used as a membrane marker, and AKT was used as a cytosol marker. The whole blot image can be found in Figure S5. (E) Cell migration capacity after treating Huh7 and Hep3B cells with 400 nM CPO for 24 h or 48 h. Scale bar = 200 µm. All results shown are from three independent experiments. Data are expressed as mean ± SD; * p < 0.05, ** p < 0.01 and *** p < 0.001 compared to control group.

