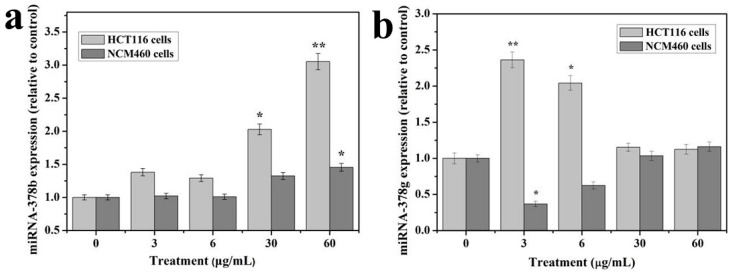
Figure 8.
The expression patterns of microRNAs 378b and 378g at 3 and 60 μg/mL treatments in HCT116 and NCM460 cell lines. (a) Expression of microRNAs 378b; (b) Expression of microRNAs 378g. The experiments were carried out as in triplicate and data presented are in represent mean values. * indicates means p < 0.05, ** indicates means p < 0.01.

