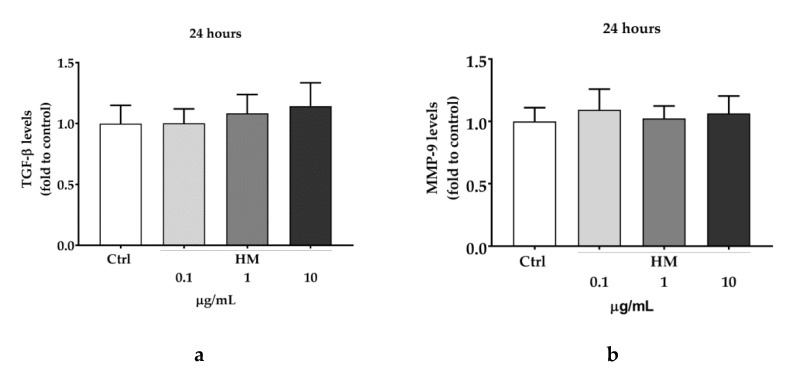
Figure 5.
Effect of HM on TGF-β levels (a) and MMP-9 release (b). HaCaT cells were treated with increasing concentrations (0.1 to 10 μg/mL) of different extract (as indicated) or DMSO (Ctrl) for 24 h. TGF-β levels and MMP-9 release were assessed by non-competitive sandwich ELISA. Data are expressed as mean ± SD of three independent experiments and normalized to the Ctrl value. One-way ANOVA was used for determining the statistical differences between groups.

