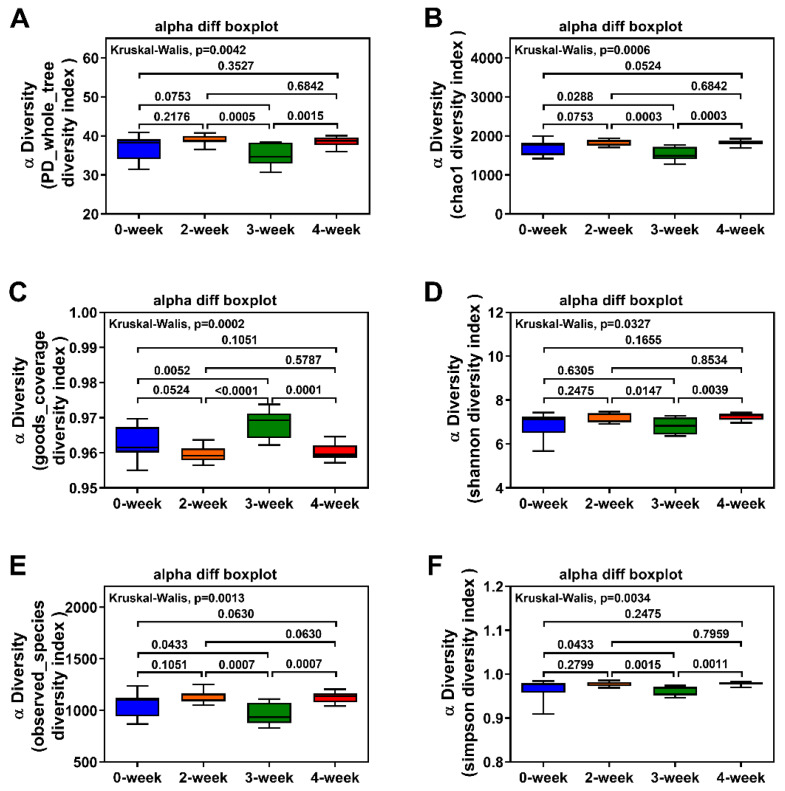
Figure 3.
Alpha diversity of the intestinal samples. Histogram plotted for the PD _whole_ tree (A), Chao-1 index (B), goods_coverage (C), Shannon index (D), observed_ species (E), and Simpson index (F). 0-week, 2-week, 3-week, and 4-week mean the group which the SD rats administrated with the caerulomycin A (CRM A) for 0, 2, 3, and 4 weeks respectively.

