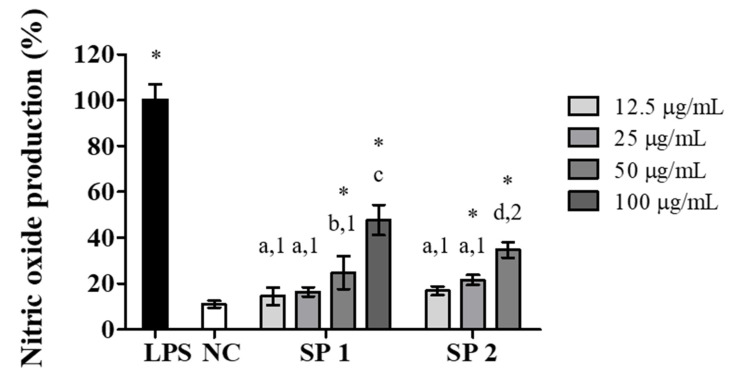
Figure 5.
Effects of SP1 and SP2 of C. cupressoides on NO production. NC—negative control; LPS—bacterial lipopolysaccharide (2 µg/mL). The data demonstrate the mean ± standard deviation (n = 3). Different letters represent statistically significant differences between SPs concentrations (p < 0.05). Different numbers represent statistically significant differences between the same concentrations of different SPs (p < 0.05). * represents samples that had a statistically significant difference in relation to the negative control (p < 0.05).

