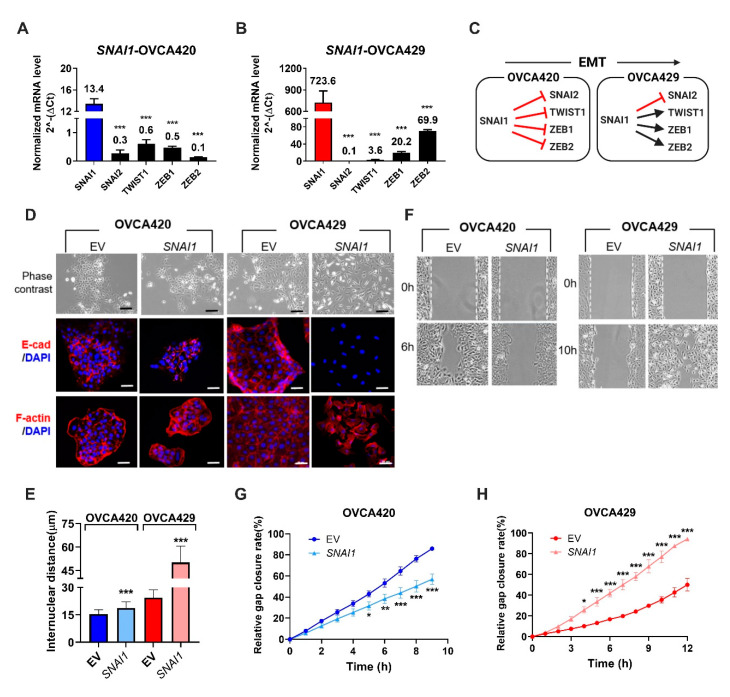
Figure 1.
SNAI1 overexpression in ovarian cancer cells induces differential morphological and phenotypic changes. (A,B) Bar charts showing normalized mRNA levels of SNAI1, SNAI2, TWIST1, ZEB1, and ZEB2 mRNA expression (y-axis) in an epithelial cell line; OVCA420 (A); and an intermediate epithelial cell line OVCA429 (B) stably overexpressing SNAI1. Mean ± SEM from three independent experiments. One-way ANOVA and Bonferroni post-hoc tests were used; *** p < 0.001 (C) Diagram illustrating a SNAI1-induced transcriptional regulatory network model using OVCA420 and OVCA429. The mRNA levels (from Figure 1A,B) ≤2 are considered as downregulated (red blocks), while levels ≥2 are considered as upregulated (black arrows). Illustration created with Biorender.com. (D) Phase-contrast images (top row), immunofluorescence staining of E-cadherin (red color, middle row), and F-actin staining (red color, bottom row) together with DAPI (blue color) of control (EV) and SNAI1-overexpression clones. Scale bars indicate 200 μm for phase-contrast images and 50 μm for immunofluorescence images. (E) Bar charts showing mean internuclear distance (y-axis, μm) of control (EV) and SNAI1-overexpression clones. Error bars represent SEM. Unpaired t-tests were used; *** p < 0.001. (F) Phase-contrast images from wound-healing migration assays showing gap closure of control (EV) and SNAI1-overexpression clones at indicated timepoints. White dotted lines denote the edges of the initial gaps. (G,H) Line graphs of control (EV) and SNAI1-overexpression clones, showing the percentage of gap area covered by cells (y-axis) at different time intervals (x-axis). Mean ± SD from two independent experiments. Two-way ANOVA and Bonferroni post-hoc tests were used. * p < 0.05, ** p < 0.01, and *** p < 0.001. EMT: epithelial-mesenchymal transition. EV: control.

