Figure 3.
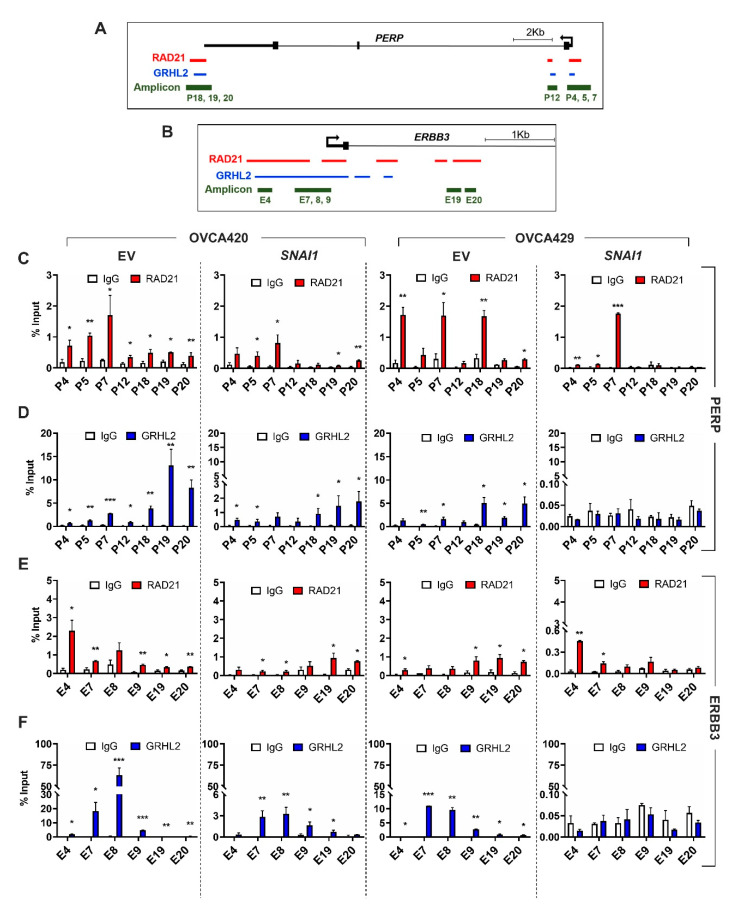
Enrichment of RAD21 and GRHL2 among regulatory regions on ERBB3 and PERP loci significantly varies along the EMT spectrum. (A,B) Schematic representation of human PERP (A) on chromosome 6q23.3 and ERBB3 (B) on chromosome 12q13.2, with pointed arrows indicating the transcription start site. RAD21 (red), GRHL2 (blue) binding sites, and the regions amplified (amplicons, green) after chromatin immunoprecipitation (ChIP) were depicted. ChIP-seq-binding regions (obtained from ReMap 2018 [36]). (C–F) ChIP assay was performed for SNAI1-overexpressing OVCA420 and OVCA429 cells and respective control cells (EV) using antibodies specific for RAD21 (red, C,E); GRHL2 (blue, D,F); or IgG (white, C–F) on PERP (C,D) or ERBB3 (E,F) gene loci. Signals were normalized to input DNA (1%) and plotted as enrichments relative to their respective IgG control. Results for at least two biological replicates were shown ± SEM. Unpaired t-tests were performed to compute statistical significances; * p < 0.05, ** p < 0.01, and *** p < 0.001.

