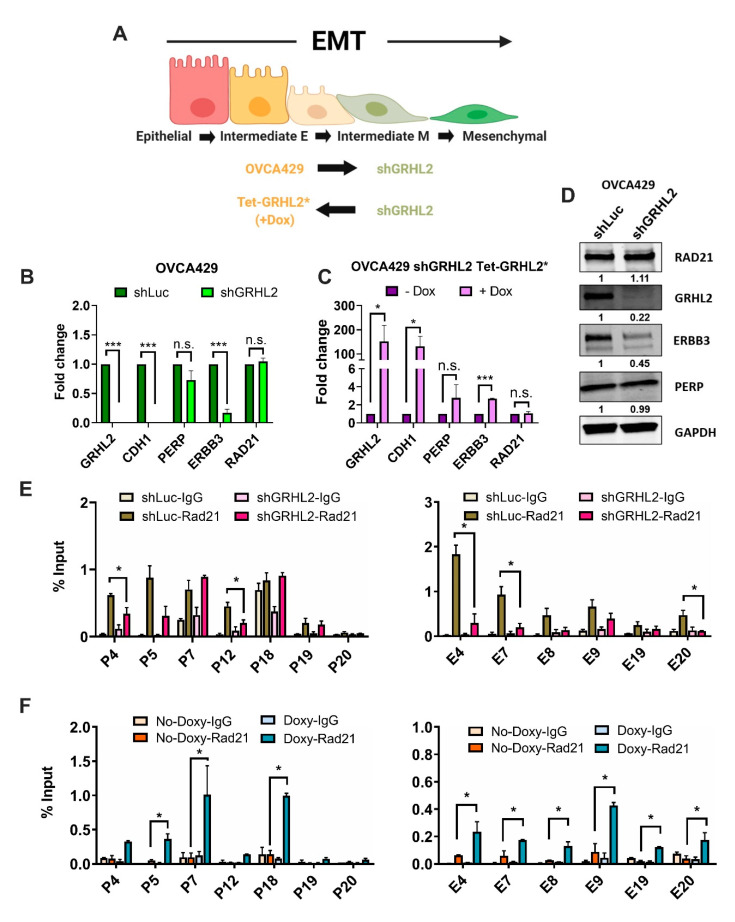
Figure 4.
GRHL2 levels partially determine RAD21 recruitment on PERP and ERBB3 loci. (A) Illustration showing the EMT spectrum model: OVCA429 GRHL2-knockdown (shGRHL2) and OVCA429 shGRHL2 Tet-GRHL2* (rescue) cells. Illustration created with Biorender.com. (B,C) Expression levels of indicated genes in control (shLuc) and GRHL2-knockdown (shGRHL2) OVCA429 cells (B) and OVCA429 shGRHL2 Tet-GRHL2* (C) cells with/without 96-h doxycycline-induced GRHL2 overexpression as analyzed through RT-qPCR. Results for at least three biological replicates were shown ± SEM. Unpaired t-tests were performed; * p < 0.05, ** p < 0.01, and *** p < 0.001. (D) Western blots of RAD21, GRHL2, ERBB3, and PERP in control (shLuc) and GRHL2-knockdown (shGRHL2) OVCA429 cells. GAPDH was used as a loading control in Western blotting. Full-length blots are available in Figure S3 from Supplementary Material. (E,F) ChIP-qPCR plots showing RAD21 enrichment levels on PERP (left) and ERBB3 (right) loci measured in control (shLuc), GRHL2-knockdown (shGRHL2) OVCA429 cells (E), and OVCA429 shGRHL2 Tet-GRHL2* (rescue) cells with/without 96-h doxycycline-induced GRHL2 overexpression (F). Signals were normalized to input DNA (1%) and plotted as enrichments relative to its respective IgG control. Results for at least two biological replicates were shown ± SEM. Unpaired t-tests were performed to compute statistical significance; * p < 0.05.

