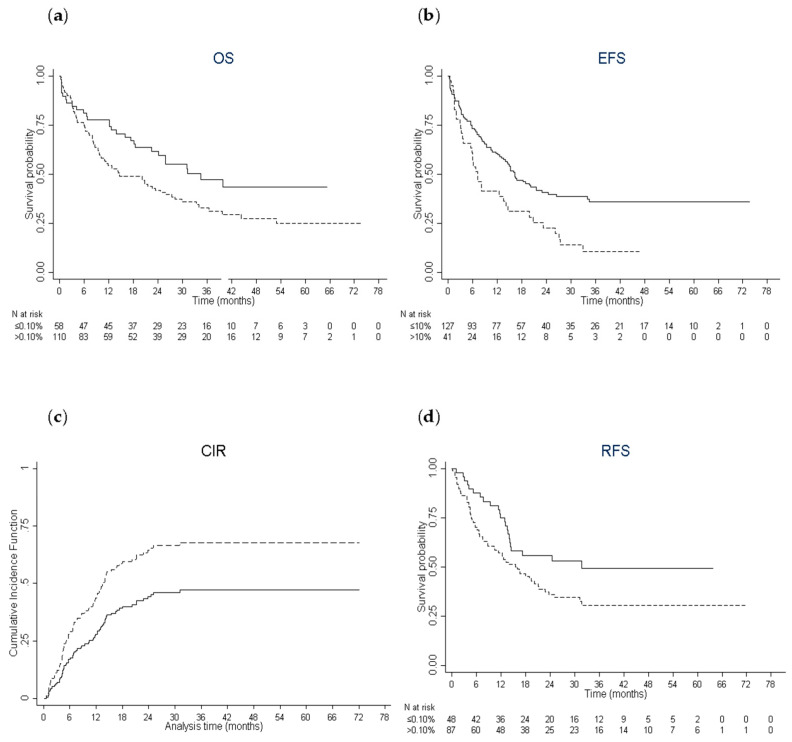
Figure 1.
Estimates of survival end points and incidence of relapse. (a) Kaplan–Meier curves for overall survival according to the leukemic stem frequency (CD34+CD38−CD123+ % ≤0.10%: solid line; >0.10%: dashed line) in patients treated by intensive chemotherapy. (b) Kaplan–Meier curves for event-free survival (CD34+CD38−CD123+ % ≤10%: solid line; >10%: dashed line). (c) Cumulative incidence of relapse (CD34+CD38−CD123+ % ≤10%: solid line; >10%: dashed line). (d) Kaplan–Meier curves for relapse-free survival (CD34+CD38−CD123+ % ≤0.10%: solid line; >0.10%: dashed line).

