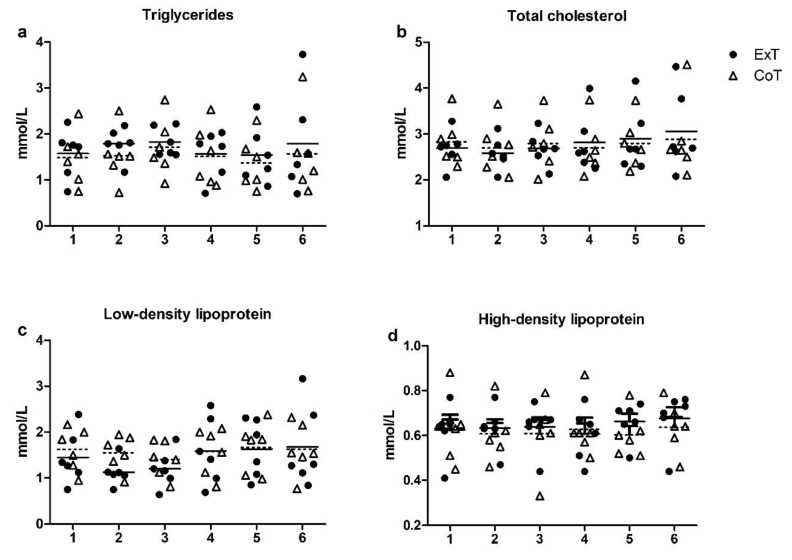
Figure 3.
Changes in plasma lipid levels following exercise (ExT) and control trial (CoT): (a) Triglycerides; (b) Total cholesterol; (c) LDL: Low Density Lipoprotein; (d) HDL: High Density Lipoprotein. Time points: (1) pre-meal; (2) 45 min post-meal (pre-exercise/control); (3) immediately post-exercise/control; (4) 1 h post-exercise/control; (5) 2 h post-exercise/control; (6) 24 h post-exercise/control. Dotted lines represent the mean values of the Control trial.

