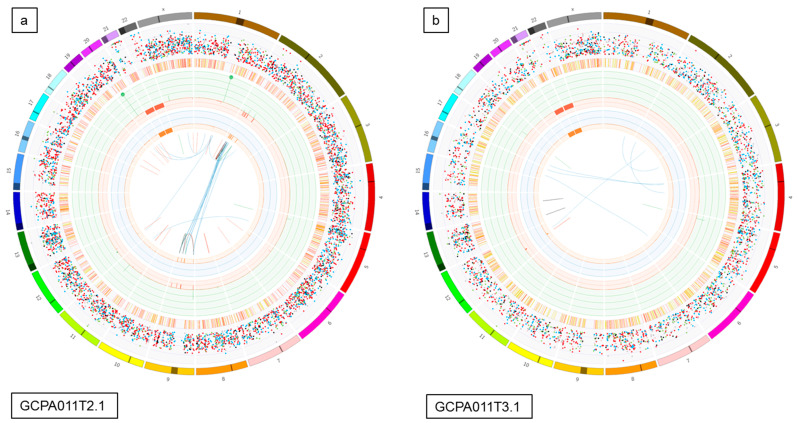
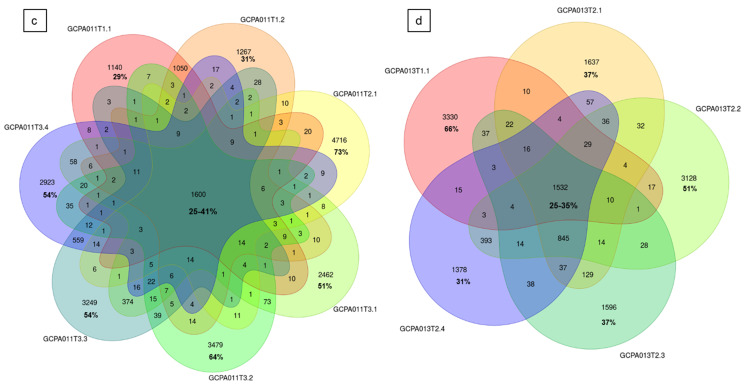
Figure 5.
Circos plots and Venn diagrams of intra-patient mutation comparisons. (a) and (b) Circos plots of samples GCPA011T2.1 and GCPA011T3.1 show differences in structural variants. The outer circle shows the chromosomes, the second circle shows the somatic single nucleotide variants, the third circle shows all observed tumor purity adjusted copy number changes, the fourth circle represents the observed ‘minor allele copy numbers’ across the chromosome, the innermost circle displays the observed structural variants within or between the chromosomes. Translocations are indicated in blue, deletions in red, insertions in yellow, tandem duplications in green and inversions in black. For detailed description of circos plots, see description of the supplementary files. (c) and (d): Venn diagram from patient 11 and 13 showing the number of unique and overlapping variants between the tumor samples. Intra-patient comparison shows 29–73% unique and 25–41% overlapping variants. The samples GCPA011T2.1 and GCPA011T3.1 have 3117–4809 unique and 1683 overlapping variants.


