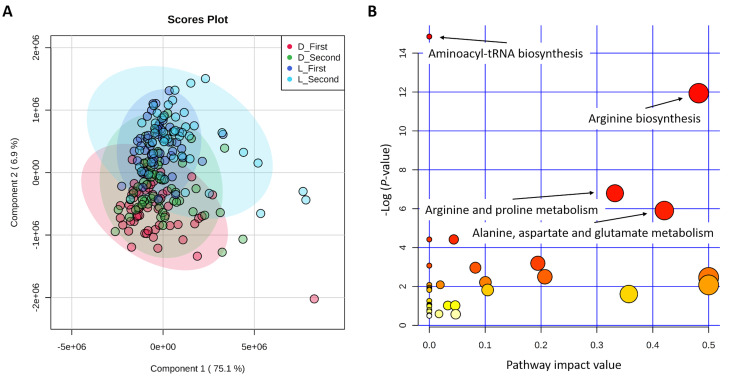
Figure 1.
(A) Partial least squares-discriminant analysis (PLS-DA) of 45 metabolites. Note: D/L with first/second indicates the sampling time of Duroc/Landrace pigs. (B) Metabolic pathways for 45 metabolites using Homo sapiens as the library. Note: The size and color of the circles for each pathway indicate the matched metabolite ratio and the −log (p-value), respectively.

