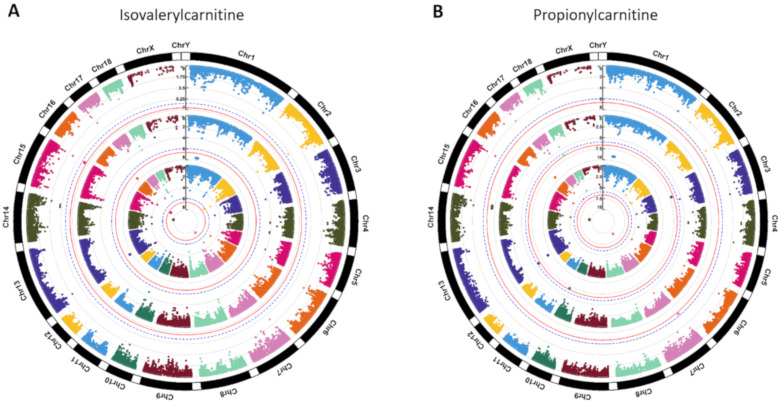
Figure 2.
Manhattan plots of genome-wide association for (A) isovalerylcarnitine and (B) propionylcarnitine. Note: Y-axis indicates the log10 (p-value). Blue dotted and red solid lines indicate the genome-wide threshold of 0.05 and 0.01 after Bonferroni multiple testing, respectively. The three tracks indicate the metabolites from first sampling time, second sampling time, and combined two sampling times from outside to inside.

