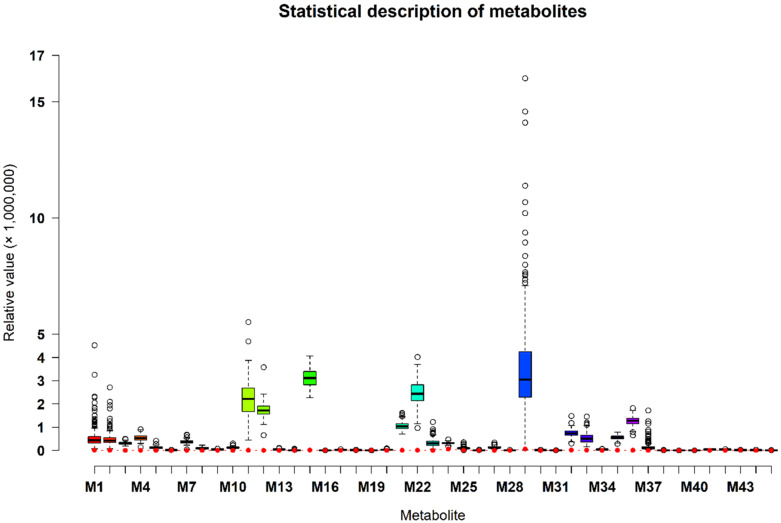
Figure 7.
Statistical description of 45 metabolites from combined two sampling times. Note: The red solid circle indicates the limit of detection (LOD) relative value of each metabolite. LOD refers to the lowest value of a metabolite that the LC-MS method can detect. M1 to M45 indicate the metabolites of 1-hexadecyl-sn-glycero-3-phosphocholine, 1-myristoyl-sn-glycero-3-phosphocholine, (3-Carboxypropyl)trimethylammonium, 4-aminobenzoic acid, 5-methyl-5,6-dihydrouracils, acetaminophen, acetylcarnitine, alanine, arginine, aspartic acid, benzoic acid, carnitine, citrulline, cotinine, creatinine, cytidine, disaccharide, glutamic acid, guanine, guanosine, hypoxanthine, indoleacrylic acid, inosine, isoleucine, isoleucyl proline, isovalerylcarnitine, lactic acid, leucyl methionine, lysoPC(16:0), manNAc, methionine, monosaccharide, nicotine amide, ornithine, phenylalanine, proline, propionylcarnitine, pyruvic acid, riboflavine, sorbitol, thiamine, threonine, thymidine, uridine, and xanthine, respectively.

