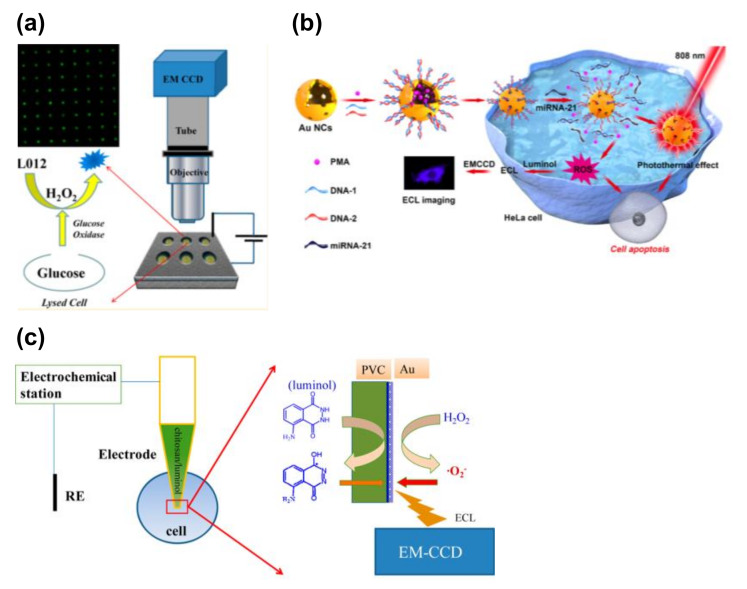
Figure 4.
ECL detection of intracellular molecules. (a) ECL detection of intracellular glucose. Individual cells were trapped inside the microwells with an indium tin oxide (ITO) electrode. Cells were lysed to release glucose, and the glucose was reacted with glucose oxidase to produce H2O2. The H2O2 was visualized using ECL imaging. Reproduced with permission from [52]. (b) ECL detection of intracellular microRNA (miRNA). Au nanoclusters (NCs) were introduced as a probe, and reactive oxygen species (ROS) were released after the miRNA recognition. The ROS were visualized using luminol at the fluorine-doped tin oxide (FTO) electrode. Reproduced with permission from [55]. (c) ECL detection of intracellular H2O2 using a capillary electrode. Chitosan/luminol was filled with the tip. Intracellular H2O2 was converted into the ECL signals. Reproduced with permission from [56].

