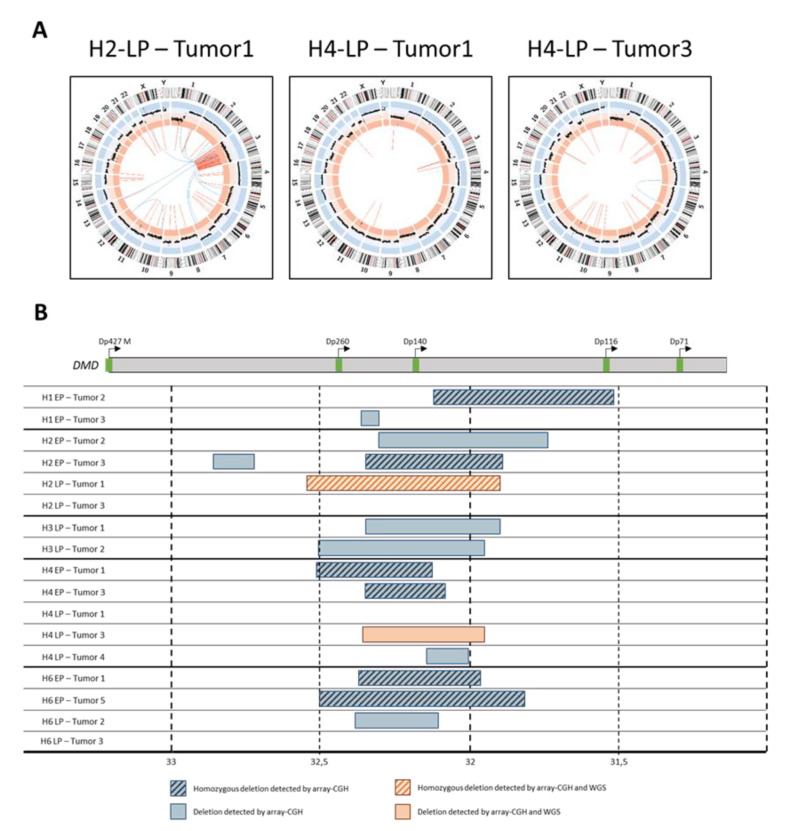
Figure 5.
Hybrid tumors present complex chromosomic rearrangement including specific DMD deletions. (A) Circos plots representing chromosome ideogram, CNV and inter (blue) and intra-chromosomic (orange) structural variations. (B) DMD deletions overview of hybrid tumors. At top, a schematic representation of DMD transcripts. At bottom, blue boxes represent deletions detected by array CGH, and orange box deletions detected also by WGS and validated by PCR and Sanger sequencing.

