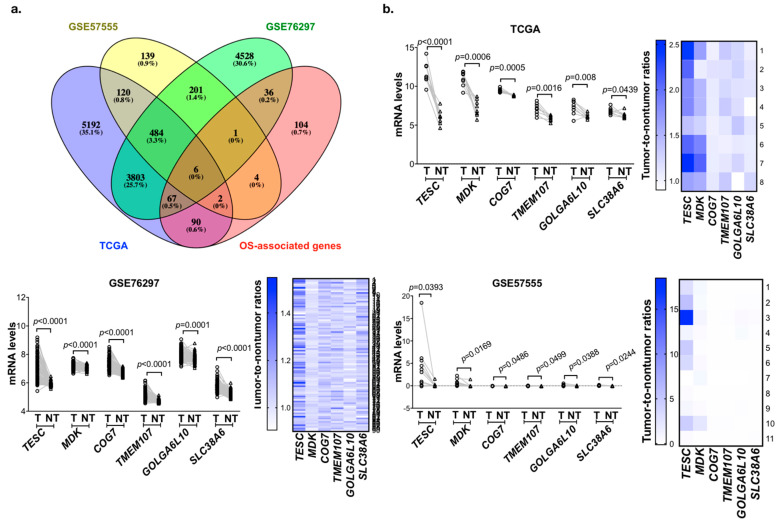
Figure 1.
Identification of candidate genes that are upregulated in cholangiocarcinoma and associated with poor survival. (a) Venn diagram of overall survival (OS)-associated gene analysis in The Cancer Genome Atlas (TCGA) and differentially expressed genes in the TCGA and Gene Expression Omnibus (GEO) databases. (b) Line plots of differential candidate genes transcript expression in paired tumor (T) and matched adjacent non-tumor (NT) tissues from the TCGA (upper), GSE76297 (bottom left,) and GSE57555 (bottom right). Heat map representing tumor-to-non-tumor ratios of candidate genes from TCGA (upper), GSE76297 (bottom left), and GSE57555 (bottom right) datasets. p-values indicate significant differences as determined by the Wilcoxon matched pairs test.

