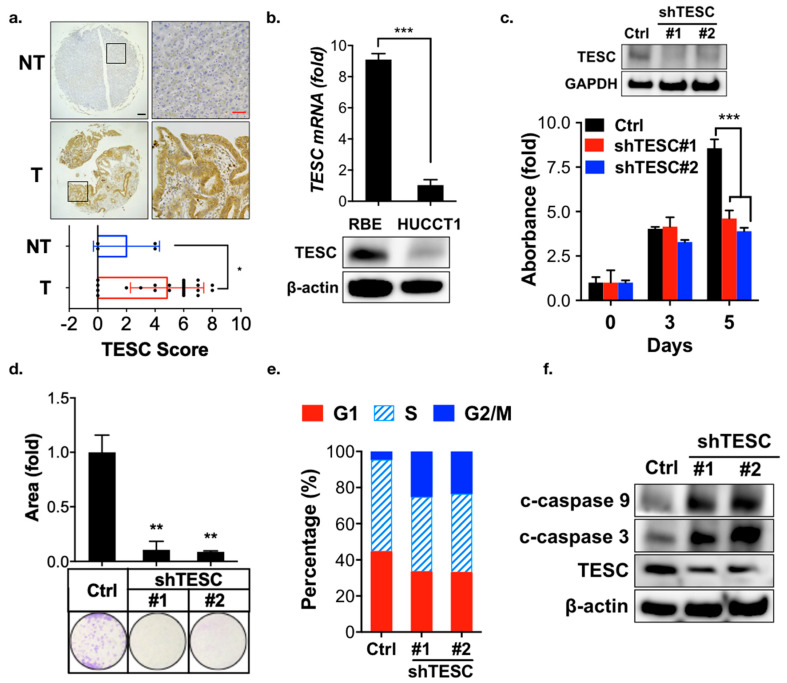
Figure 3.
Participation of TESC in ICC oncogenesis. (a) Representative images of immunohistochemical staining for TESC expression in tumors (T), with a non-tumor (NT) tissue as a negative staining control (upper). Scatter plot shows differential expression of TESC in tumor (T) and non-tumor (NT) tissues (bottom). Black scale bar, 150 μm; red scale bar, 50 μm. * p < 0.05. (b) qPCR (upper) and immunoblotting (bottom) analysis of TESC expression in RBE and HUCCT1 cells. Results are representative of three independent experiments and expressed as the mean ± SD; *** p < 0.001. (c) MTT (3-[4,5-Dimethylthiazol-2-yl]-2,5-diphenyltertrazolium bromide) analysis of proliferation of RBE cells infected with lentiviral vectors encoding shTESC or scrambled control (Ctrl). The level of TESC was assessed through immunoblotting (upper). #1 and #2 indicate distinct shRNAs targeting different regions within TESC. The results are representative of three independent experiments and expressed as the mean ± SD; *** p < 0.001. (d) Clonogenic assay of RBE cells infected with lentiviral vectors encoding shTESC or scrambled control for 14 days. Top: colonies were stained with crystal violet and quantified. Bottom: representative plates were photographed. ** p < 0.01. (e) Cell cycle analysis of the loss of the TESC effect on the cell cycle in RBE cells infected with lentiviral vectors encoding shTESC or scrambled control for 5 days. (f) Immunoblotting analysis was used to assess the effect of TESC silencing on cleaved (c)-caspase 3 and c-caspase 9 expression in RBE cells infected with lentiviral vectors encoding shTESC or scrambled control (Ctrl).

