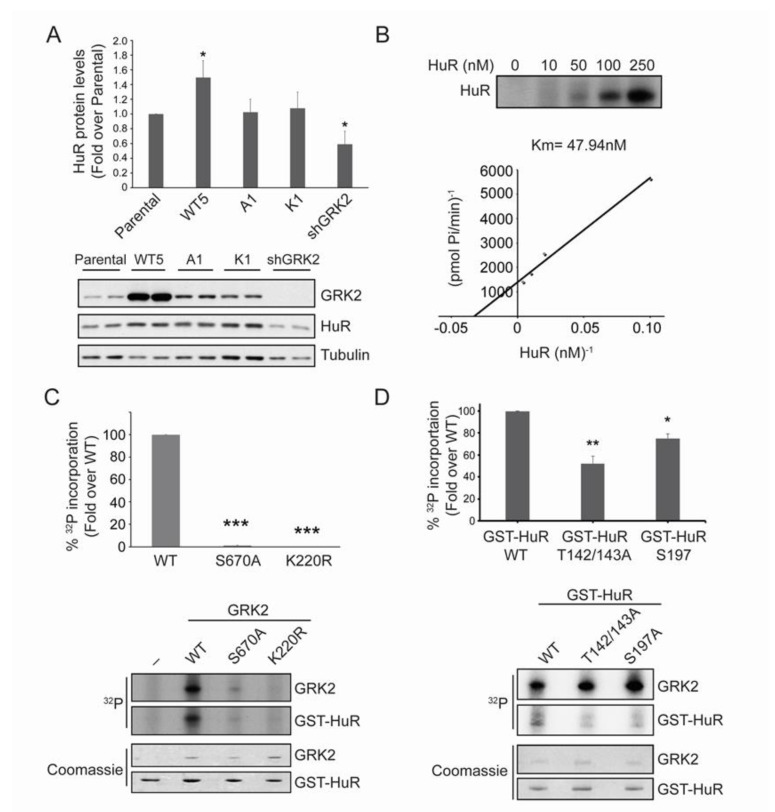
Figure 1.
GRK2 phosphorylates and regulates HuR. (A) HuR total levels were analyzed by immunoblotting of the total lysates of parental and HeLa cell lines over-expressing wild-type GRK2 (Hela-WT5), a mutant lacking the ability to phosphorylate a subset of GRK2 substrates (Hela-A1), the catalytically inactive GRK2-K220R mutant (Hela-K1) or harboring stable GRK2 silencing (Hela-shGRK2). Values are mean ± SEM from four independent experiments. * p < 0.05 vs. parental (Student’s t-test). (B) GRK2 and GST-HuR were incubated in the presence of [γ-32P]-ATP, as detailed in Materials and Methods. Km was estimated by double-reciprocal plot analysis of three independent experiments. (C) Phosphorylation of GST-HuR was performed in the presence of [γ-32P]-ATP using recombinant GRK2-WT, GRK2-S670A, or GRK2-K220R proteins, as described in Materials and Methods. Intensity of 32P and the Coomassie bands were quantified by densitometry and plotted as a percentage of WT GRK2-triggered 32P incorporation. Data representative of two independent experiments are shown. *** p < 0.001 vs. parental (Student’s t-test). (D) GRK2 (50 nM) and GST-HuR, GST-HuR-T142/143A, or GST-HuR-S197A (100 nM) were incubated in the presence of [γ-32P]-ATP, as detailed in Materials and Methods. Intensity of the 32P and Coomassie bands was quantified by densitometry and plotted as a percentage of GRK2-triggered 32P incorporation. The graph shows fold differences in two independent experiments. * p < 0.05 vs. WT ** p < 0.01 vs. WT (1-way ANOVA). Detailed information about the Western blots can be found in Figure S2.

