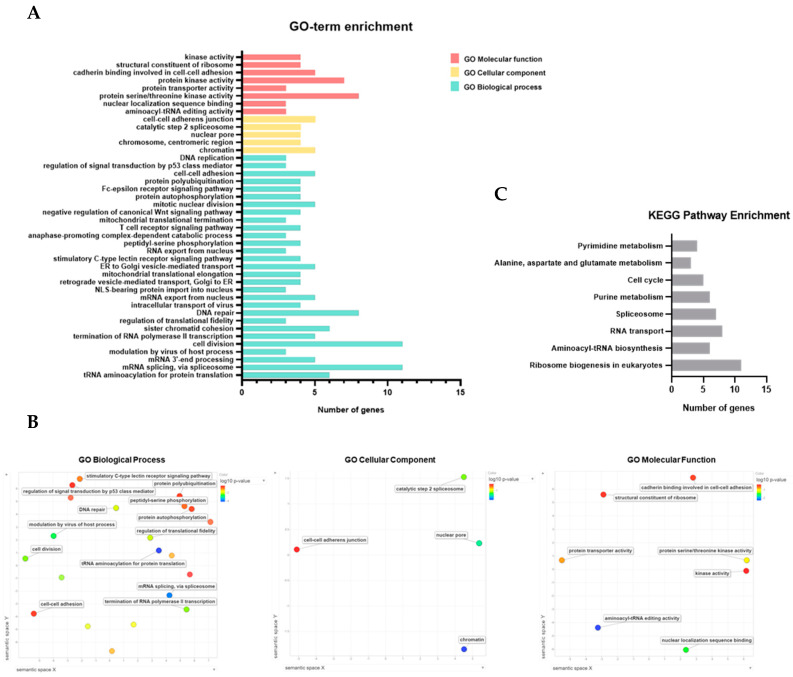
Figure 6.
Functional enrichment analysis of JMJD10 in stomach adenocarcinoma. (A) Box plot representing enriched GO terms includes GO molecular function, cellular component, and biological process enrichment. (B) Semantic similarity-based scatterplots of GO-term enrichment results; the axes have no intrinsic meaning; semantically similar GO terms are closer together in the plot. (C) Box plot representing KEGG pathway enrichment results.

