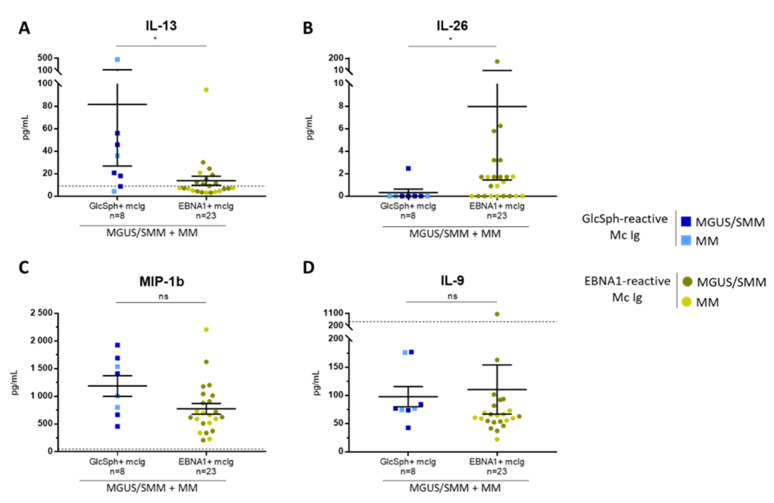
Figure 7.
Differences in cytokine levels according to the presence of GlcSph- or EBV EBNA-1-reactive monoclonal Ig for MGUS/SMM and MM patients. The levels of 2 cytokines, IL-13 (A) and IL-26 (B) were significantly different depending on the antigen specificity of the monoclonal Ig, whereas the levels of MIP-1β (C) and IL-9 (D) were not. Note that each figure has a different scale; bars indicate means ± SEM. GlcSph+: with GlcSph-reactive monoclonal (mc) IgG; EBNA-1+: with EBV EBNA-1-reactive mc IgG. (■) MGUS/SMM and (■) MM patients with GlcSph-reactive mc IgG; (⬤) MGUS/SMM and (⬤) MM patients with an EBNA-1-reactive mc IgG. (*) p < 0.05, Mann–Whitney t-test. The dotted line represents the highest normal value observed in healthy donors. NS: not significant.

